Russia’s oil and gas sector, a cornerstone of its economy, continues to face significant headwinds, evidenced by a sharp decline in export revenues and production figures. Fresh data reveals that August 2025 saw Russian oil and fuel export revenues plummet to $13.51 billion, a notable drop of $920 million from the prior month and one of the lowest levels recorded since the onset of the conflict in Ukraine. This erosion of critical income streams, driven by a confluence of Western sanctions, a widening discount on its benchmark Urals crude, and operational disruptions, presents a complex picture for global energy investors. Understanding these dynamics is paramount as the market navigates persistent supply-side pressures and evolving geopolitical landscapes.
The Deepening Impact on Russian Oil Revenues and Production
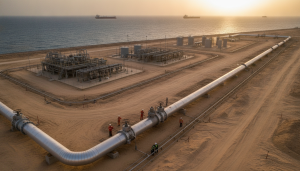
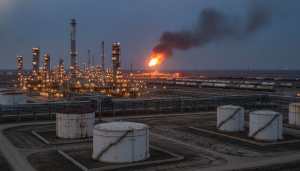
The latest figures underscore a challenging environment for Russia’s energy exports. In August 2025, overall oil and fuel exports eased by 70,000 barrels per day, settling at 7.3 million bpd. This reduction was multifaceted, with crude oil exports declining by 30,000 bpd and fuel products seeing a 40,000 bpd drop. Crucially, the average price for Russia’s flagship Urals blend traded around $56 per barrel, remaining stubbornly below the Western-imposed price cap of $60 per barrel. This persistent discount, alongside the decrease in export volumes, directly contributed to the significant $920 million fall in monthly revenue. The broader economic implications are stark; these revenue levels are reportedly hovering near five-year lows, exerting considerable pressure on Russia’s tax revenues and exacerbating its ongoing economic slowdown. Beyond market dynamics, the industry has also contended with direct challenges, including reported drone strikes impacting oil refineries and export infrastructure, adding layers of operational risk and cost.
Navigating Global Market Volatility Amidst Geopolitical Pressures
While Russia grapples with its specific challenges, the global oil market itself is experiencing significant price volatility, a critical factor for all energy investors to monitor. As of today, Brent crude futures are trading at $90.38 per barrel, marking a substantial daily decline of 9.07%, with prices fluctuating within a range of $86.08 to $98.97. Similarly, WTI crude stands at $82.59 per barrel, down 9.41% on the day. This recent downturn reflects a broader bearish sentiment, following a pronounced trend over the past two weeks where Brent shed $20.91, or 18.5%, from its March 30th peak of $112.78 to $91.87 just yesterday. The price of gasoline has also felt the impact, currently at $2.93 per gallon, a decrease of 5.18%. This broader market softness, driven by a combination of demand concerns and shifts in risk appetite, compounds the financial pressure on producers globally, including those operating under the duress of sanctions. Investors must analyze how these macro price movements interact with the structural discounts faced by Russian crude, creating a complex risk and reward profile for the energy sector.
OPEC+ Strategy and the Investor Outlook for 2026
A central question frequently posed by our discerning investor community concerns the future trajectory of oil prices through the end of 2026 and, critically, the current production quotas set by OPEC+. Russia’s recent production figures provide direct insight into this dynamic; its oil output declined by 30,000 bpd in August 2025 to 9.3 million bpd, a move consistent with the output quotas agreed upon by the OPEC+ alliance. This adherence suggests a continued commitment to market management, which is particularly relevant given the upcoming high-stakes meetings. The Joint Ministerial Monitoring Committee (JMMC) of OPEC+ is scheduled to convene tomorrow, April 18th, followed by the Full Ministerial Meeting on April 19th. These gatherings are pivotal, as the alliance will assess current market conditions, global demand forecasts, and compliance levels. Any adjustments to production targets or shifts in rhetoric from these meetings could significantly influence global supply expectations and, consequently, crude oil prices, impacting the profitability of energy investments and the fiscal health of oil-producing nations, including Russia.
Key Indicators for Informed Energy Investing
Beyond the immediate OPEC+ decisions, sophisticated energy investors are consistently tracking a range of critical data points to inform their strategies and predict market movements. Understanding these forward-looking indicators is essential for anyone asking about year-end oil price predictions or the underlying data powering market analysis. The coming weeks present several opportunities for fresh insights. The American Petroleum Institute (API) will release its Weekly Crude Inventory report on April 21st and again on April 28th, providing an early look at U.S. stock levels. These will be closely followed by the official U.S. Energy Information Administration (EIA) Weekly Petroleum Status Reports on April 22nd and April 29th, which offer comprehensive data on crude oil, gasoline, and distillate inventories, as well as refinery utilization. Furthermore, the Baker Hughes Rig Count, scheduled for April 24th and May 1st, offers crucial intelligence on drilling activity and future production trends in North America. Collective analysis of these reports provides invaluable signals on supply-demand balances, helping investors gauge market tightness or surplus. For those focused on the long game, these regular data releases are indispensable for making informed decisions in a volatile energy landscape.