The energy sector continues to be a dominant force shaping broader market profitability, and nowhere is this more evident than in the operational costs of energy-intensive industries. While oil prices have seen some recent recalibration, their sustained elevation presents a significant headwind for sectors like precious metal mining, directly impacting earnings per share and potentially driving deeper market corrections than previously anticipated. At OilMarketCap.com, our proprietary data pipelines reveal a complex interplay of supply dynamics, geopolitical tensions, and investor sentiment that demands careful analysis for strategic positioning.
Oil Price Headwinds and Miner Profitability: A Historical Perspective
The fundamental premise is straightforward: when crude oil prices rise significantly, the cost of extracting and processing raw materials for miners escalates. This directly erodes profit margins and, consequently, shareholder value. To gauge the potential impact on precious metal miners, it’s instructive to examine historical parallels. Our analysis often draws comparisons to the 2008 financial crisis, a period characterized by a broad market decline and subsequent commodity volatility. During that time, gold, silver, and mining stocks experienced an initial synchronized downturn. However, gold demonstrated a robust recovery, while the broader stock market continued its descent. A crucial detail from that period, which bears relevance today, is that mining stocks eventually outperformed gold once the general market found its bottom, albeit several months later. Silver’s rebound, while present, was somewhat more muted. The key distinction in the current environment is the added pressure of persistently high energy input costs, which could push the correction low for miners even further down compared to the 2008 benchmark, making their eventual rebound potentially more challenging or delayed.
Current Market Dynamics: Geopolitical Tensions and Supply Constraints
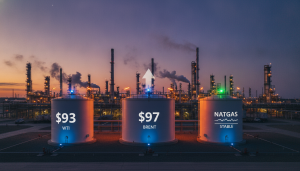
The current energy landscape is defined by a confluence of factors keeping crude prices firm. As of today, Brent crude trades at $92.89, reflecting a slight dip of 0.38% within a daily range of $92.57 to $94.21. WTI crude mirrors this trend, standing at $89.33. While our proprietary 14-day trend data indicates Brent has softened by approximately 7% from $101.16 on April 1st to $94.09 yesterday, these prices remain substantially elevated from a historical perspective and continue to exert pressure on corporate bottom lines across various sectors. The market is grappling with ongoing geopolitical risks, particularly the potential for sustained supply disruptions from key regions, such as those that might arise from prolonged conflict or the closure of vital shipping lanes like the Strait of Hormuz. Unlike past downturns where a rallying U.S. Dollar Index and declining economic activity quickly suppressed crude demand, the current scenario sees the USD Index already strengthening without a corresponding significant decline in oil prices. This suggests that the traditional “pressure valve” of lower demand might be less effective due to persistent supply-side vulnerabilities, creating a higher floor for crude prices even amidst broader economic headwinds.
Investor Sentiment and Forward Outlook: What Our Readers Are Asking
Investor sentiment, as captured by our first-party intent data, clearly indicates a strong focus on the directional trajectory of crude oil prices. Many on our platform are asking about the immediate future of WTI and Brent, seeking clarity on whether recent price fluctuations represent a temporary blip or the start of a more sustained trend. Furthermore, a significant number of inquiries pertain to the long-term outlook, with investors eager to understand where oil prices might settle by the end of 2026 and the implications for major energy companies. This reflects a broader concern about the stability of energy costs and their downstream impact on corporate profitability, extending beyond the direct oil and gas sector to industries like mining. The sustained high cost environment fuels questions about the resilience of earnings for energy-intensive firms and whether current market valuations adequately reflect these ongoing operational pressures. Our analysis suggests that while short-term volatility is always a factor, the underlying supply constraints and geopolitical risks are likely to keep a floor under prices, necessitating a cautious approach for investors expecting a rapid return to significantly lower energy costs.
Key Market Events on the Horizon: Navigating Volatility
For investors seeking to navigate the complex interplay of supply, demand, and price discovery, the upcoming energy calendar offers several critical data points. This week, the EIA Weekly Petroleum Status Report on Wednesday, April 22nd, will provide crucial insights into U.S. crude oil and product inventories, refinery utilization, and demand indicators. This will be followed by the Baker Hughes Rig Count on Friday, April 24th, offering a snapshot of North American drilling activity and future supply trends. Looking into the following week, the API Weekly Crude Inventory report on Tuesday, April 28th, provides an early indication of inventory shifts, preceding another EIA Weekly Petroleum Status Report on Wednesday, April 29th. The first week of May brings further clarity with the Baker Hughes Rig Count on May 1st, and most significantly, the EIA Short-Term Energy Outlook on May 2nd. This comprehensive outlook from the EIA is pivotal for shaping mid-to-long term price and supply/demand forecasts, directly addressing the longer-term questions our readers are posing. Finally, further API and EIA weekly reports on May 5th and 6th will round out the immediate data flow. These scheduled releases are not merely statistical updates; they are vital signals that will either confirm or challenge prevailing market narratives, offering investors opportunities to refine their strategies and position themselves ahead of potential market shifts.