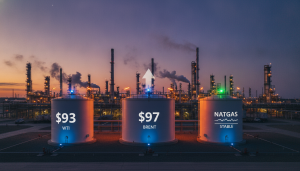
The energy market currently presents a curious dichotomy. While Brent crude trades at $92.89 as of today, showing a marginal dip of 0.38% within a day’s range of $92.57 to $94.21, and has softened by approximately 7% from its $101.16 peak at the start of April, other foundational commodity markets tell a different story. The relative tranquility in crude prices belies a simmering inflationary pressure, particularly evident in the silver market, which serves as a critical bellwether for industrial demand and supply chain resilience. An in-depth look at silver, often overlooked by dedicated energy investors, reveals potent forces that could fundamentally reshape our outlook on oil’s trajectory toward the $100 mark and beyond.
AI Infrastructure: A Silent Driver of Commodity Inflation
The explosive growth of Artificial Intelligence is not just a technological revolution; it’s a profound shift in industrial commodity demand. Goldman Sachs projects a staggering 165% increase in data center power demand by 2030. Every single one of these data centers is a voracious consumer of silver, critical for server electrical contacts, high-frequency cables, thermal interface materials, and power distribution systems. Unlike solar panels, where material thrifting has reduced silver content per unit, data center applications have no commercially viable substitute for high-frequency electrical contacts and thermal management, creating a uniquely price-inelastic demand.
Our internal estimates, scaling silver intensity per gigawatt of installed IT capacity against Goldman Sachs’ projection of approximately 50 GW installed in 2025 growing to approximately 122 GW by 2030, indicate that AI and data center infrastructure is consuming 60-80 million ounces (Moz) of silver annually, and this figure is growing. This positions AI infrastructure as the third-largest category of silver industrial demand, trailing only solar and general electronics. Furthermore, the global memory chip shortage, projected to persist through at least late 2027, adds a compounding factor. Each high-bandwidth memory chip requires silver in die-attach materials and wire bonding. This bottleneck, while potentially pacing AI deployment, simultaneously ensures sustained and inelastic silver demand from the semiconductor supply chain. When projects are valued in the hundreds of billions of dollars, the cost of silver becomes a negligible rounding error, meaning builders will pay whatever the market demands.
Geopolitical Risks and the Energy Supply Chain
The intricate web of global supply chains means that disruptions in one commodity market invariably ripple through others, including energy. Geopolitical tensions, such as those in the Middle East, while not directly silver-specific, amplify every other market driver. Higher oil prices, for instance, directly raise mining costs for an industry that is already struggling to increase output at current commodity prices. Shipping disruptions, a common consequence of regional instability, further tighten markets already facing structural deficits. The silver market has registered a sixth consecutive structural deficit, a situation that highlights broader challenges in global resource extraction and logistics. For energy investors, this signals that underlying supply constraints and cost pressures are pervasive, threatening to push crude oil and natural gas prices higher as operating expenses for producers escalate.
As of today, Brent crude trades at $92.89, representing a modest 0.38% decline. WTI crude also shows a slight downtick, trading at $89.51, down 0.18%. This recent softening, which has seen Brent pull back from $101.16 at the start of April to $94.09 yesterday, a decline of 7% over two weeks, could be interpreted as a market sigh of relief. However, this calm might be deceptive. The February correction in other commodity markets, while shaking out speculative positions, did not resolve fundamental imbalances. If anything, lower prices often encourage more physical accumulation, a dynamic that has characterized several commodity markets since 2021. This suggests that the current dip in crude may not reflect a fundamental shift in supply/demand dynamics, but rather a temporary recalibration before underlying pressures reassert themselves.
Investor Focus: Navigating Price Volatility and Future Outlook
Our proprietary reader intent data reveals a consistent theme this week: investors are keenly focused on directional price movements and future forecasts. Questions like “is WTI going up or down?” and “what do you predict the price of oil per barrel will be by end of 2026?” underscore the uncertainty and the urgent need for clarity in a volatile market. The silver market’s situation offers a valuable parallel: with COMEX being asked to deliver 53 million ounces in March against 89 million registered, and with AI infrastructure consuming 60-80 Moz annually, the physical market stress is undeniable. Such imbalances, even if not immediately mirrored in headline crude prices, point to broader inflationary undercurrents that cannot be ignored by energy investors.
Looking ahead, the next few weeks are packed with crucial data points that will undoubtedly influence investor sentiment and market direction. The EIA Weekly Petroleum Status Reports on April 22, April 29, and May 6 will provide fresh insights into crude oil, gasoline, and distillate inventories, as well as refinery utilization rates. These reports are critical for gauging the health of demand and the efficiency of the supply chain. Complementing these, the Baker Hughes Rig Counts on April 24 and May 1 will offer a snapshot of drilling activity, indicating future production trends. Furthermore, the API Weekly Crude Inventory reports on April 28 and May 5 often serve as precursors to the official EIA data. Finally, the EIA Short-Term Energy Outlook on May 2 will provide a comprehensive forecast for supply, demand, and prices, offering a foundational perspective for the coming months. These events, combined with persistent factors like China’s export controls (now in their 68th day, fragmenting global supply chains), will be pivotal in shaping the near-term narrative for crude oil and could easily reignite upward price momentum, challenging the current market calm and pushing Brent back towards the $100 threshold.