
What has been happening in the Middle East when it comes to markets won’t affect only headlines but could reshape the structure of the oil market from the physical barrel to the far end of the derivatives curve. As tensions escalate, physical traders are going to have to rethink their physical routes, and will have to recalibrate the forward curve – opposite to equity markets, oil markets use the forward curve to hedge, not spot. Because of that, you will also see a repricing of volatility, adjusting skew, and deployment of option structures that reflect deep uncertainty about outcomes.
Oil is uniquely sensitive to geopolitical stress because so much of the global supply transits narrow chokepoints. Even the threat of disruption can change pricing dynamics before a single barrel is lost – or takes longer to get to the end point. In these environments, the most important signals often lie not in the outright price of crude but in the shape of the forward curve and the behavior of the options market as a consequence. The option market has become a big player in the oil space in the last decade.
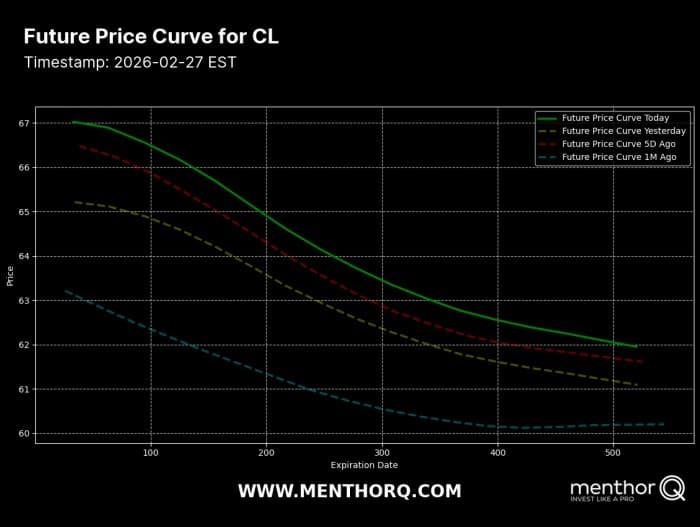
Spot and Forward Curve Responses to Crisis
When geopolitical risk intensifies, the first observable shift is often in the front of the curve. If traders believe there is a credible risk of immediate supply disruption, nearby contracts tend to rally faster than deferred contracts. The result is a steepening of backwardation. That means, that the front of the curve moves very high, in the physical space, traders start bidding spot hard on fears of supply disruptions. Related: How China’s Rare Earth Ban Backfired into a U.S. Tech Breakthrough
Backwardation reflects a market that values immediate barrels more than future barrels. During crisis conditions, refiners and physical buyers are willing to pay a premium for prompt delivery to secure supply continuity. This drives up the front month relative to the second and third months. The curve tightens. This affects time spreads and crack spreads for refineries. Remember, refiners can’t delay the crude supply, they can only use what they have stored. But that is a dangerous bet; a refiner cannot be switched on and off. Once the asset is off, it is very complicated and costly to restart, so managing that supply is very important and sensitive to price – for new barrels, old barrels in tanks are hedged.
As the market re-opens post escalation, the shape of the curve depends on how participants interpret the shock. If traders believe the disruption will be short-lived or largely symbolic, the front may spike while the back end remains anchored by long term supply expectations. Eventually, the front will soften and come back. That produces a sharp kink in the curve. If, on the other hand, the conflict threatens prolonged production losses or structural export constraints, deferred contracts can also move higher, flattening or even shifting the entire curve upward. If the entire curve stays in backwardation but moves higher, then the market will have a problem. Note as of last Friday, the curve had already shifted higher.
Storage and Roll Yields
The curve shape has direct implications for storage and roll yields. In strong backwardation, holding physical inventory is costly because future prices are lower than spot prices. Traders are incentivized to release barrels into the market rather than store them. Storage tanks are empty. Roll yields are positive for long futures positions because, as contracts approach expiry, they converge downward toward a lower deferred price.
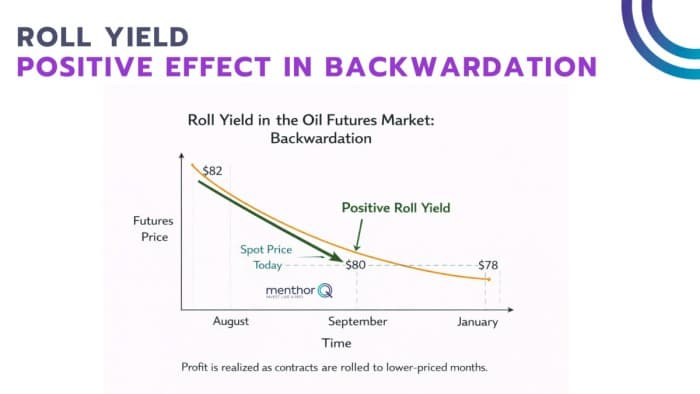
In contango, the opposite happens. Future prices exceed spot, allowing traders to buy physical oil, store it, and sell forward at a higher price. The spread must exceed storage, financing, and operational costs to be attractive. In crisis-driven contango tied to demand fears, storage can fill quickly, as seen in previous oil shocks.
For physical trading desks, these shifts determine hedging and arbitrage strategies. A refiner may lock in margins differently depending on whether backwardation is steepening due to supply fear or flattening due to policy intervention. A producer may accelerate or delay hedging programs depending on how far deferred prices move relative to spot. Obviously, while all of this takes time, it is not immediate in the physical market. But the market dynamic will change how participants think about risk when the market opens on Monday 2nd of March.
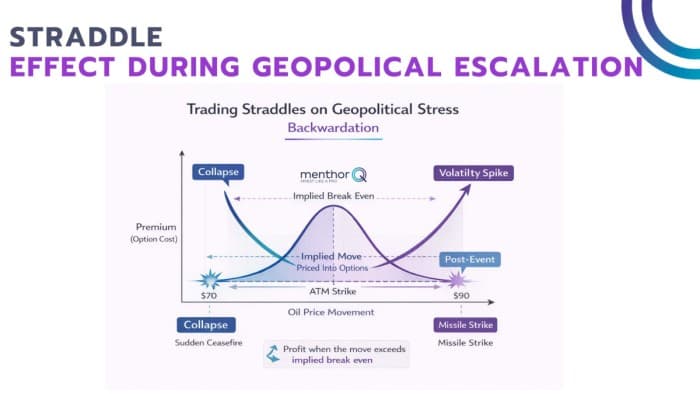
Straddles Around Key News Events
When diplomatic talks, military escalations, or potential strike announcements are scheduled or rumored, implied volatility often rises sharply in the front month.
In such environments, traders frequently deploy straddles. A straddle involves buying both a call and a put at the same strike, typically at the money. The strategy profits from large moves in either direction. It does not require predicting whether oil will spike or collapse. It requires that the move exceed the implied break-even embedded in the option premiums.
War creates exactly this kind of binary uncertainty. A missile strike could send prices sharply higher. A sudden ceasefire or diplomatic breakthrough could collapse the war premium just as quickly. The straddle aligns with this real-world distribution of outcomes.
The key variable is break even volatility. When traders price straddles, they implicitly define how much movement they expect over the option’s life. If geopolitical uncertainty increases realized volatility beyond that expectation, long straddles profit. If the event passes quietly and prices remain range bound, implied volatility collapses and long straddles lose value.
Sophisticated desks analyze the implied move priced by the market ahead of key events. For example, if the at-the-money straddle implies a five-dollar move over the next week, the trader must assess whether the potential escalation risk justifies that premium. In extreme war scenarios, implied volatility can overshoot realized outcomes, leading to rapid post-event vol crush.
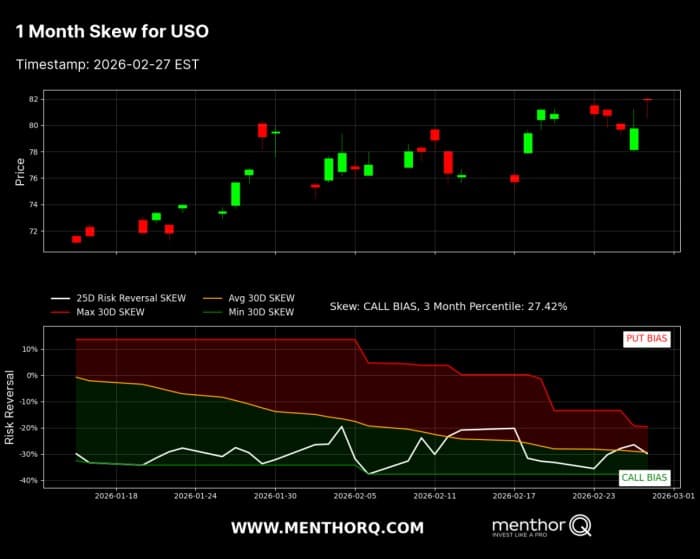
Skew as a Signal of Asymmetric Risk Perception
Beyond the money volatility lies skew, the difference in implied volatility between out-of-the-money calls and puts. Skew reveals how the market prices asymmetric risk.
In oil markets during war fears, upside risk often dominates. A credible threat to supply routes such as the Strait of Hormuz introduces tail risk to the upside. The video we posted earlier does a good job explaining what happens when the Strait is closed; it has ripple effects.
Traders buy out-of-the-money calls as insurance against a spike. This lift call implied volatility relative to puts, creating positive call skew. However, skew can invert depending on the macro backdrop. If the conflict threatens global growth or triggers financial contagion, demand destruction becomes the dominant fear. In that case, out-of-the-money puts become more expensive as traders hedge against downside collapse. Put skew steepens.
The evolution of skew provides a real-time barometer of trader psychology. A market pricing high call skew is expressing fear of supply disruption and price spikes. A market pricing high put skew is expressing fear of recession and demand contraction.
Risk reversals, which measure the implied volatility difference between equidistant calls and puts, quantify this asymmetry. A positive risk reversal signals greater demand for upside protection. A negative one signals demand for downside hedges.
In war environments, skew can shift rapidly as narratives change. A single headline can rotate the dominant risk from supply shock to demand shock within hours. Watching skew dynamics is often more informative than watching the outright price.
This is the USO skew at the end of last week, before the escalations.
Physical Disruptions Beckon Financial Pricing Adjustments
Now, since virtual barrels have increased in the last decade, the most important link is the feedback loop between physical threats and financial repricing.
When physical supply appears at risk, refiners and producers adjust hedges. Producers may hesitate to lock in forward sales if they believe prices will rise further. Physical desks alter inventory management. These actions flow directly into futures spreads and options order flow.
Options markets respond by raising implied volatility, adjusting skew, and repricing break-evens. Market makers widen bid-ask spreads. Vega demand increases. Front-month volatility often lifts relative to deferred months, reflecting concentrated near term uncertainty.
The pricing of break-even volatility is the market’s attempt to quantify geopolitical uncertainty. A high implied vol environment signals that traders collectively assign meaningful probability to large price swings. Risk reversals confirm whether that swing is expected to be up or down. The forward curve encodes how persistent the shock is expected to be.
If tensions de-escalate, the war premium collapses. Backwardation can flatten. Implied volatility compresses. Skew normalizes. If escalation intensifies, the process reinforces itself. Physical hoarding tightens prompt supply. The front of the curve spikes. Calls become expensive. Straddles reprice higher.
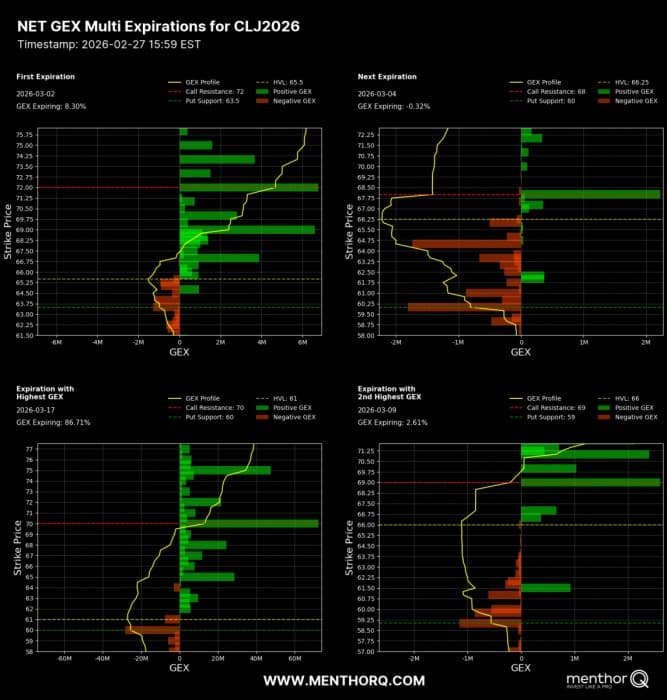
GEX profile
What you will want to keep a close attention to is also how the GEX profile changes. As the GEX profile changes, you are going to see which price levels become more important as participants move their strikes and market makers hedge across the curve. This was the NetGex for CL as of Friday.
GEX and Gamma levels are becoming particularly important for oil futures traders. Because while fundamentals are always at play in this space, the increased volumes of options in the oil market mean that option positioning and the effect it has on its price is becoming more and more important. Understanding these dynamics can help you trade key levels directionally or just use those levels for option spreads strike selection.
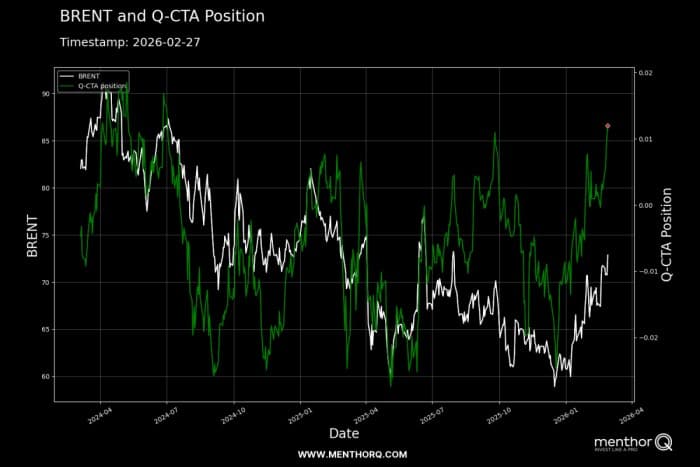
The Machines
Finally, watch for CTAs. If the price starts trending higher, machines are going to start buying very aggressively. Notice that there is a lot of dry powder right now. They can do some real damage to the upside when prices start trending. The machines were already long going into Friday.
Conclusion
Oil markets during conflict are therefore not just reacting to barrels lost. They are reacting to expectations about future states of the world. The forward curve, the straddle premium, and the skew structure are all expressions of collective belief under uncertainty. GEX helps you understand positioning and if CTAs are activated further they can create real pain to the upside.
By MenthorQ for Oilprice.com
More Top Reads From Oilprice.com