The global crude market finds itself at a critical juncture, with geopolitical tensions surrounding Iran’s nuclear program once again taking center stage. As investors grapple with the potential for escalating conflict, the price of oil reflects a complex interplay of fear, fundamental supply dynamics, and technical signals. Our proprietary data pipelines reveal a market exhibiting significant volatility, with today’s strong rally contrasting sharply with a notable decline over the past two weeks. Understanding these crosscurrents is paramount for any energy investor looking to navigate the uncertain path ahead.
Geopolitical Tensions Drive Crude’s Risk Premium: The Iran Factor
The immediate catalyst for market apprehension stems from the impending nuclear negotiations between the United States and Iran, scheduled to resume in Geneva this Thursday. The stakes are exceptionally high, with Washington demanding a cessation of Iran’s nuclear activities, a demand Tehran has thus far resisted, asserting its sovereign rights while denying any atomic weapons aspirations. The rhetoric has been further amplified by President Trump’s recent declaration of a narrow 10-to-15-day window before considering military action, raising the specter of a potential US attack as early as this weekend if a substantive deal or even a framework agreement fails to materialize from this round of talks.
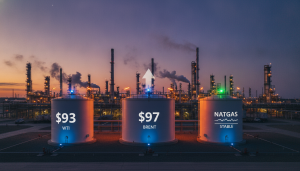
As of today, Brent Crude trades at $93.86, marking a significant 3.79% gain from its opening, with an intraday range of $89.11-$95.53. Similarly, WTI Crude stands at $90.22, up 3.2% for the day, navigating a range of $85.50-$92.23. This immediate surge in prices clearly reflects a heightened risk premium being factored in by aggressive traders hedging against the worst-case scenario: a tangible disruption in global oil supply. Further underscoring the gravity of the situation, reports confirm the US State Department’s decision to pull non-essential government personnel and their families from the embassy in Beirut, a move often preceding heightened regional instability. While no oil supply has been physically lost yet, the market’s current trajectory suggests investors are actively pricing in a significant protective buffer against potential conflict.
Navigating Market Volatility: Today’s Gains Amidst Recent Retreat
Today’s robust gains in crude benchmarks might suggest a universally bullish outlook, yet a deeper dive into our proprietary trend data reveals a more nuanced picture. While Brent Crude has climbed nearly 3.8% today, this daily rally comes on the heels of a substantial retreat over the past fortnight. Our 14-day Brent trend analysis shows the benchmark having shed nearly 20%, specifically $23.49 from $118.35 on March 31st to $94.86 just yesterday. This significant swing underscores the extreme volatility inherent in the current energy landscape, where short-term geopolitical fears can temporarily overshadow longer-term market fundamentals.
For investors keenly asking “is WTI going up or down?”, the answer is complex and depends heavily on the time horizon and prevailing catalysts. Today, the answer is unequivocally “up,” driven by the Iran risk premium. However, the preceding two weeks demonstrated a clear downward trend, likely influenced by broader macroeconomic concerns or perhaps a re-evaluation of demand forecasts. This push-pull dynamic means that while a military confrontation could send prices soaring further, any de-escalation or clarity on supply-demand fundamentals could quickly reverse these gains. The aggressive hedging observed in the market, which previously provided a 6% to 10% protection premium, illustrates how quickly traders are adjusting their positions in response to rapidly evolving headlines.
Technical Indicators at Play: Seeking Confirmation in a Dynamic Market
In such a volatile environment, technical analysis offers crucial signposts for discerning underlying market strength and potential trend shifts. While specific price support levels from earlier periods, such as those in the $60-$65 range, are now significantly distant from today’s elevated crude prices, the principles of technical indicators remain highly relevant. Market technicians are closely monitoring the behavior of key moving averages, which provide insights into short-term momentum and long-term trends. A significant development on the horizon is the anticipated crossover of the 50-day moving average above the 200-day moving average. This “golden cross” is widely regarded as a strong bullish signal, often preceding periods of sustained upward price action.
Should such a crossover materialize at current or even higher price levels, it would lend technical confirmation to the market’s underlying strength, suggesting that the recent bullish momentum, partly fueled by geopolitical risk, could evolve into a more entrenched uptrend. Investors are watching for this signal to determine if the market is building new, higher technical foundations for future price movements. Conversely, a failure to sustain momentum or a breakdown below established support could signal a re-evaluation, but for now, the technical setup suggests an underlying bullish bias is attempting to assert itself, despite the near-term volatility driven by geopolitical headlines.
Beyond Geopolitics: Upcoming Catalysts for Energy Market Direction
While the Iran negotiations understandably capture immediate attention, a host of scheduled energy events will provide critical insights into the fundamental supply and demand balance, which ultimately dictates the longer-term trajectory for oil prices. Investors seeking to predict “the price of oil per barrel by end of 2026” must integrate these regular updates into their analysis.
Today, April 21st, the OPEC+ Joint Ministerial Monitoring Committee (JMMC) convenes, offering a crucial window into potential adjustments to global production quotas. Any hints of supply tightening or easing from this influential group can immediately sway market sentiment. Looking ahead, the EIA Weekly Petroleum Status Reports on April 22nd and April 29th, alongside the API Weekly Crude Inventory updates on April 28th and May 5th, will provide granular data on US crude stockpiles, refinery activity, and demand indicators. These reports are invaluable for assessing the health of the world’s largest oil consumer.
Furthermore, the Baker Hughes Rig Count, slated for April 24th and May 1st, offers a real-time gauge of drilling activity, indicating future supply potential from North American producers. Finally, the EIA Short-Term Energy Outlook on May 2nd will deliver a comprehensive forecast for global supply, demand, and prices, often recalibrating market expectations for the coming months and year. These events, though less dramatic than geopolitical flashpoints, collectively paint a robust picture of the market’s underlying health and will be instrumental in shaping price discovery well beyond the immediate Iran crisis.