Global EV Battery Market Sees Decelerating Growth Amidst Asian Dominance and Shifting Demand
The global landscape for electric vehicle battery manufacturing continues to be profoundly shaped by Asian powerhouses, with an exclusive cohort of Chinese, South Korean, and Japanese firms dominating the top ten market positions. As the first quarter of 2026 draws to a close, market intelligence points to a notable deceleration in growth within this critical sector, presenting a nuanced picture for energy investors monitoring the pace of the global energy transition.
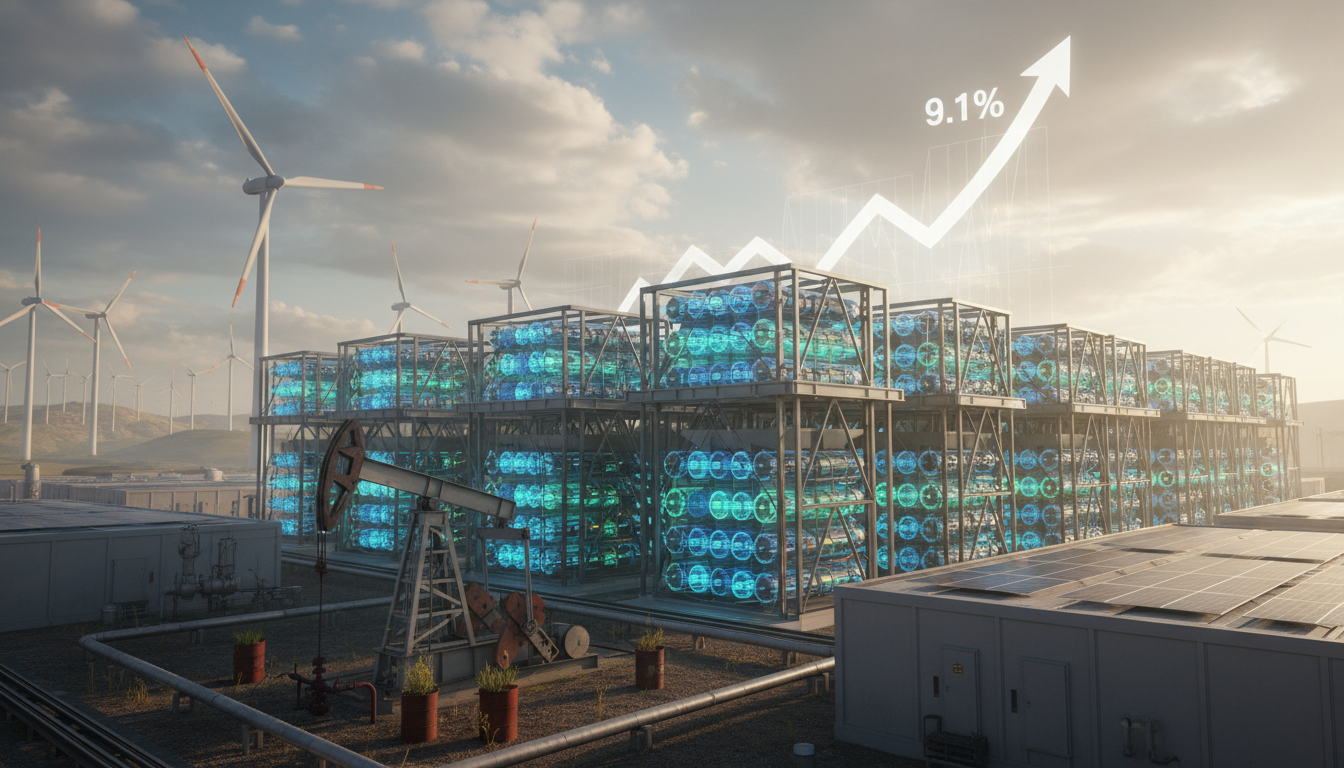
Total production of battery cells for electric vehicles, encompassing battery-electric, plug-in hybrid, and conventional hybrid applications, expanded by 9.1 percent, reaching 244.6 GWh in Q1 2026. While this represents continued expansion, it marks a significant slowdown compared to the robust 31.7 percent growth witnessed across the full year 2025. This moderation in the EV battery segment holds direct implications for long-term oil demand forecasts and capital allocation within traditional energy infrastructure. A slower electrification pace in key markets could extend the lifespan of internal combustion engine vehicles, thereby influencing crude oil pricing and upstream investment strategies for years to come.
Geopolitical Currents: Asian Hegemony in Battery Production
The strategic concentration of EV battery manufacturing in Asia underscores an ongoing geopolitical dynamic. Chinese firms CATL and BYD remain the undisputed leaders, followed by South Korea’s LG Energy Solution. This geographic centralization of critical technology raises questions for Western nations concerning supply chain resilience, resource dependency, and the broader implications for energy independence. Investors in the energy sector must account for these geopolitical complexities, as trade policies, international relations, and regional manufacturing incentives will undeniably influence the global energy mix and raw material markets.
South Korean Giants Navigate Headwinds
South Korean battery manufacturers, a crucial component of the global supply chain, collectively faced a challenging quarter. LG Energy Solution, SK On, and Samsung SDI saw their combined global market share shrink to 15.6 percent in the first three months of 2026, a 2.1 percentage point reduction from the prior year. This decline signals intensifying competition and potential shifts in original equipment manufacturer (OEM) partnerships that warrant close observation from an investment perspective.
Within this trio, LG Energy Solution demonstrated resilience, posting a 6.6 percent increase in production to 23.7 GWh, cementing its position as the top South Korean producer. However, its counterparts experienced notable contractions. SK On saw its production volumes decrease by 10.4 percent, falling to 9.0 GWh. This downturn was significantly influenced by the discontinuation of key contracts, including its supply to the Ford F-150 Lightning and the cessation of VW ID.4 production in the United States. Samsung SDI experienced an even sharper decline, with production dropping by 27.7 percent to 5.3 GWh. These performance discrepancies highlight the volatility inherent in supplier relationships within the rapidly evolving automotive industry and their direct impact on individual battery manufacturers’ financial health and long-term viability.
CATL’s Strategic Expansion Amidst Market Shifts
Chinese market leader CATL further solidified its dominant position, expanding its production by 15.2 percent to an impressive 99.5 GWh. The company’s strategic agility allowed it to benefit from robust demand from domestic Chinese electric vehicle manufacturers such as Nio and Zeekr. This internal market strength provided a buffer against reduced order volumes from Tesla, which experienced declining sales for its Model 3. Moreover, CATL’s proactive approach to customer diversification, securing increased supplies to major global automakers like Toyota, Kia, and Skoda, demonstrates a calculated move to mitigate risks and secure future growth avenues. For energy investors, CATL’s trajectory is a key indicator of the underlying health and direction of the global EV transition, particularly given its outsized influence on critical mineral demand and battery technology advancements.
BYD Faces Domestic Sales Challenges
BYD, the world’s second-largest battery producer and China’s leading cell manufacturer, experienced a production decline of 8.0 percent, settling at 33.5 GWh for the quarter. This dip is primarily attributed to a slowdown in domestic sales of BYD’s own automotive brand, a reminder of the dual challenges faced by companies that are both battery suppliers and vehicle manufacturers. While sales to external clients, such as Xiaomi, offered some counterbalance, weak order volumes from significant partners like Xpeng, Nio, and its subsidiary Denza underscore the competitive pressures and demand fluctuations within the Chinese EV market. The performance of integrated players like BYD offers a microcosm of the broader EV market’s complexities, where automotive sales directly impact battery production metrics.
Q1 2026 Global EV Battery Cell Production: Top 10 Breakdown
The following table provides a clear snapshot of the competitive landscape in global EV battery cell production for the first quarter of 2026:
| Rank | Name | Share |
|---|---|---|
| 1 | CATL | 40.7 per cent |
| 2 | BYD | 13.7 per cent |
| 3 | LG Energy Solution | 9.7 per cent |
| 4 | CALB | 4.8 per cent |
| 5 | Gotion | 4.2 per cent |
| 6 | Panasonic | 3.7 per cent | 7 | SK On | 3.7 per cent |
| 8 | EVE | 3.1 per cent |
| 9 | SVOLT | 2.7 per cent |
| 10 | Sunwoda | 2.2 per cent |
This concentrated market structure, where the top two players command over 50% of the market, signals significant barriers to entry and reinforces the strategic importance of these established Asian manufacturers. For oil and gas investors, understanding these market shares is critical for assessing the long-term trajectory of electrification and its implications for fossil fuel demand.
Navigating a Structural Transition: Implications for Energy Investors
The global battery market appears to be entering a critical structural transition phase, characterized by diverging demand trends across key regions. While battery demand has seen recent declines in significant markets like China and North America, other regions, including parts of Asia, Europe, and emerging economies, are experiencing an uptick. This geographic segmentation of demand presents both opportunities and challenges for cell manufacturers, requiring adaptability and strategic foresight in capacity planning and market engagement.
For investors focused on the broader energy sector, these developments are paramount. A fragmented and regionally disparate electrification pathway complicates forecasts for global oil demand peak and decline. While slower EV adoption in some major markets might offer a reprieve for crude oil consumption in the near term, robust growth elsewhere ensures the energy transition remains a powerful, albeit uneven, force. The imperative for oil and gas companies remains clear: diversify portfolios, enhance operational efficiencies, and closely monitor the nuanced evolution of the EV market to inform sustainable capital allocation and long-term strategic positioning within the shifting global energy matrix.