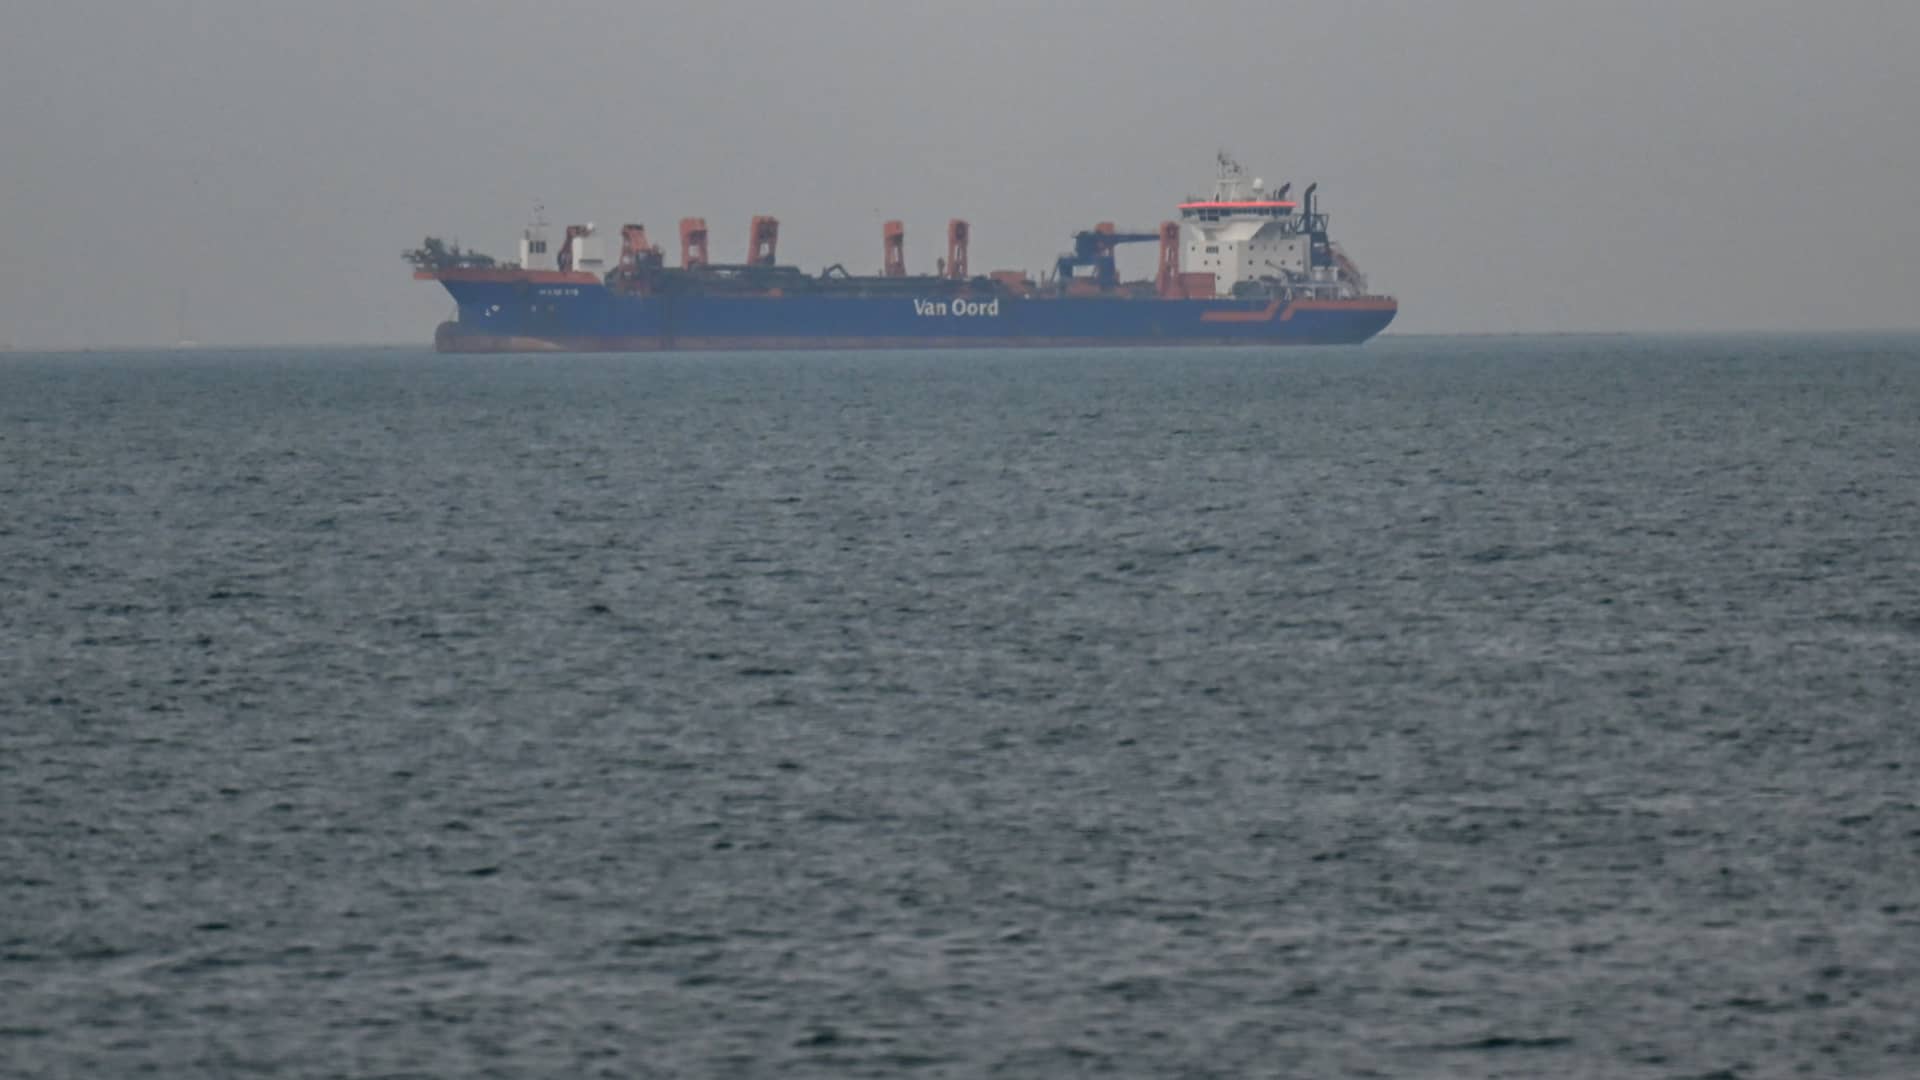
The Strait of Hormuz, a critical maritime chokepoint, has once again become the epicenter of global energy market anxiety. Recent disruptions, including the closure warnings from Iran and direct attacks on Qatari energy infrastructure, are sending profound shockwaves through the supply chain. While the immediate focus is on geopolitical escalations, savvy investors must look beyond the headlines to understand the underlying vulnerabilities and identify which nations face the most acute physical and financial strain. Our proprietary market data and reader intent signals highlight a period of intense volatility and uncertainty, underscoring the necessity of a granular, forward-looking analysis.
The Strait’s Chokehold: Market Realities and Price Volatility
The strategic importance of the Strait of Hormuz cannot be overstated. Functioning as a vital artery for global energy trade, approximately 13 million barrels per day (bpd) of crude oil transited the waterway in 2025, accounting for roughly 31% of all seaborne crude flows. Any prolonged disruption here triggers immediate and severe repercussions across the globe. Beyond crude, about 20% of global liquefied natural gas (LNG) exports, predominantly from Qatar, are also at risk, underscoring the dual threat to both oil and gas markets.
Investor sentiment has been whipsawed by these developments. As of today, April 21, 2026, Brent Crude trades at $93.90 per barrel, up 0.71% in today’s session, while WTI Crude stands at $90.38 per barrel, marking a 0.79% increase. However, a glance at our 14-day Brent trend data reveals a more complex picture. While the initial conflict spurred a significant price surge, pushing Brent well past the $80 mark, it also peaked significantly higher, reaching $118.35 on March 31, 2026. Since then, we’ve observed a notable correction, with prices declining by nearly 20% to $94.86 by April 20, 2026, before today’s slight rebound. This trajectory indicates that while the geopolitical risk premium remains embedded, the market has also processed and recalibrated its expectations, though significant volatility persists. This rapid price movement is precisely what keeps our readers asking, “is WTI going up or down?” – a clear indicator of the market’s current indecision and the heightened need for clarity.
Asia’s Acute Vulnerability: Mapping Import Dependencies
When assessing national exposure, Asia stands out as the region facing the maximum pain from Hormuz disruptions. Our analysis, aligned with industry observations, points to countries like Thailand, India, South Korea, and the Philippines as particularly vulnerable due to their high energy import dependence. These nations rely heavily on Gulf energy supplies, making them susceptible to both physical supply disruptions and significant financial shocks from surging prices.
India, for instance, faces the largest combined exposure in the region. Over half of its LNG imports are Gulf-linked, and a substantial share of its long-term LNG contracts are Brent-indexed. This means a Hormuz-driven crude spike simultaneously lifts oil import costs and escalates LNG contract prices, creating a severe dual physical and financial shock. Furthermore, approximately 60% of India’s oil imports originate from the Middle East. Similarly, Pakistan and Bangladesh, with limited storage and procurement flexibility, are acutely vulnerable. Pakistan imports 99% of its LNG from Qatar and the UAE, while Bangladesh sources 72% from the same region. For Bangladesh, this vulnerability is compounded by an existing structural gas deficit exceeding 1,300 million cubic feet per day, meaning disruptions could trigger rapid power-sector demand destruction rather than aggressive spot bidding.
Beyond Crude: The LNG Crisis and Regional Strain
While crude oil often dominates headlines, the LNG market is experiencing an equally critical moment. The recent drone strikes on Qatar’s facilities at Ras Laffan and Mesaieed Industrial Cities, which led to a halt in production, exacerbate an already tense situation. Qatar is one of the world’s largest LNG providers, and its exports, primarily shipped via the Strait of Hormuz, represent about 20% of global LNG trade. This direct hit to supply, coupled with the transit risk, places immense pressure on key importers.
The impact is most acutely felt in South Asia. Pakistan and Bangladesh are particularly exposed, with Qatar and the UAE accounting for 99% and 72% of their respective LNG imports. Unlike some larger economies, these nations possess limited flexibility in securing alternative supplies or managing storage, leaving them highly susceptible to immediate shortages and price spikes. India, while having greater scale, still sees 53% of its LNG imports tied to Qatar and the UAE, making it deeply intertwined with the Gulf’s energy fate. The implications for these nations extend beyond economic hardship, potentially impacting industrial activity, power generation, and overall energy security.
Navigating Future Volatility: Investor Outlook and Upcoming Catalysts
Given the persistent geopolitical risks and the intricate web of energy dependencies, investors are rightly concerned about the future direction of oil and gas prices. Our reader intent data shows a clear desire to understand, “what do you predict the price of oil per barrel will be by end of 2026?” While precise predictions are challenging amidst such volatility, several upcoming events will provide critical signals for the market.
This week alone, the OPEC+ Joint Ministerial Monitoring Committee (JMMC) Meeting on April 21, 2026, will be closely watched for any indications regarding production policies. With current prices elevated but off recent highs, any rhetoric or action from OPEC+ could significantly influence sentiment. Following this, the EIA Weekly Petroleum Status Reports on April 22 and April 29, 2026, will offer crucial insights into U.S. crude oil and product inventories, which could either alleviate or intensify supply concerns. The Baker Hughes Rig Count on April 24 and May 1, 2026, will provide a barometer of future supply potential. Looking slightly further out, the EIA Short-Term Energy Outlook on May 2, 2026, will present updated forecasts for global supply and demand, offering a comprehensive perspective on market fundamentals that could help frame the rest of the year.
The combination of ongoing geopolitical tension, direct supply disruptions, and the upcoming slate of market-moving events points to continued price sensitivity. Investors must remain agile, focusing on companies with robust supply chain diversification, strong balance sheets, and strategic positions that can mitigate or even capitalize on these evolving risks. The Strait of Hormuz remains a potent reminder of the fragility of global energy flows and the premium on informed, forward-looking analysis.