Navigating Oil Market Volatility: Why Today’s Risks Diverge from 1970s Stagflation
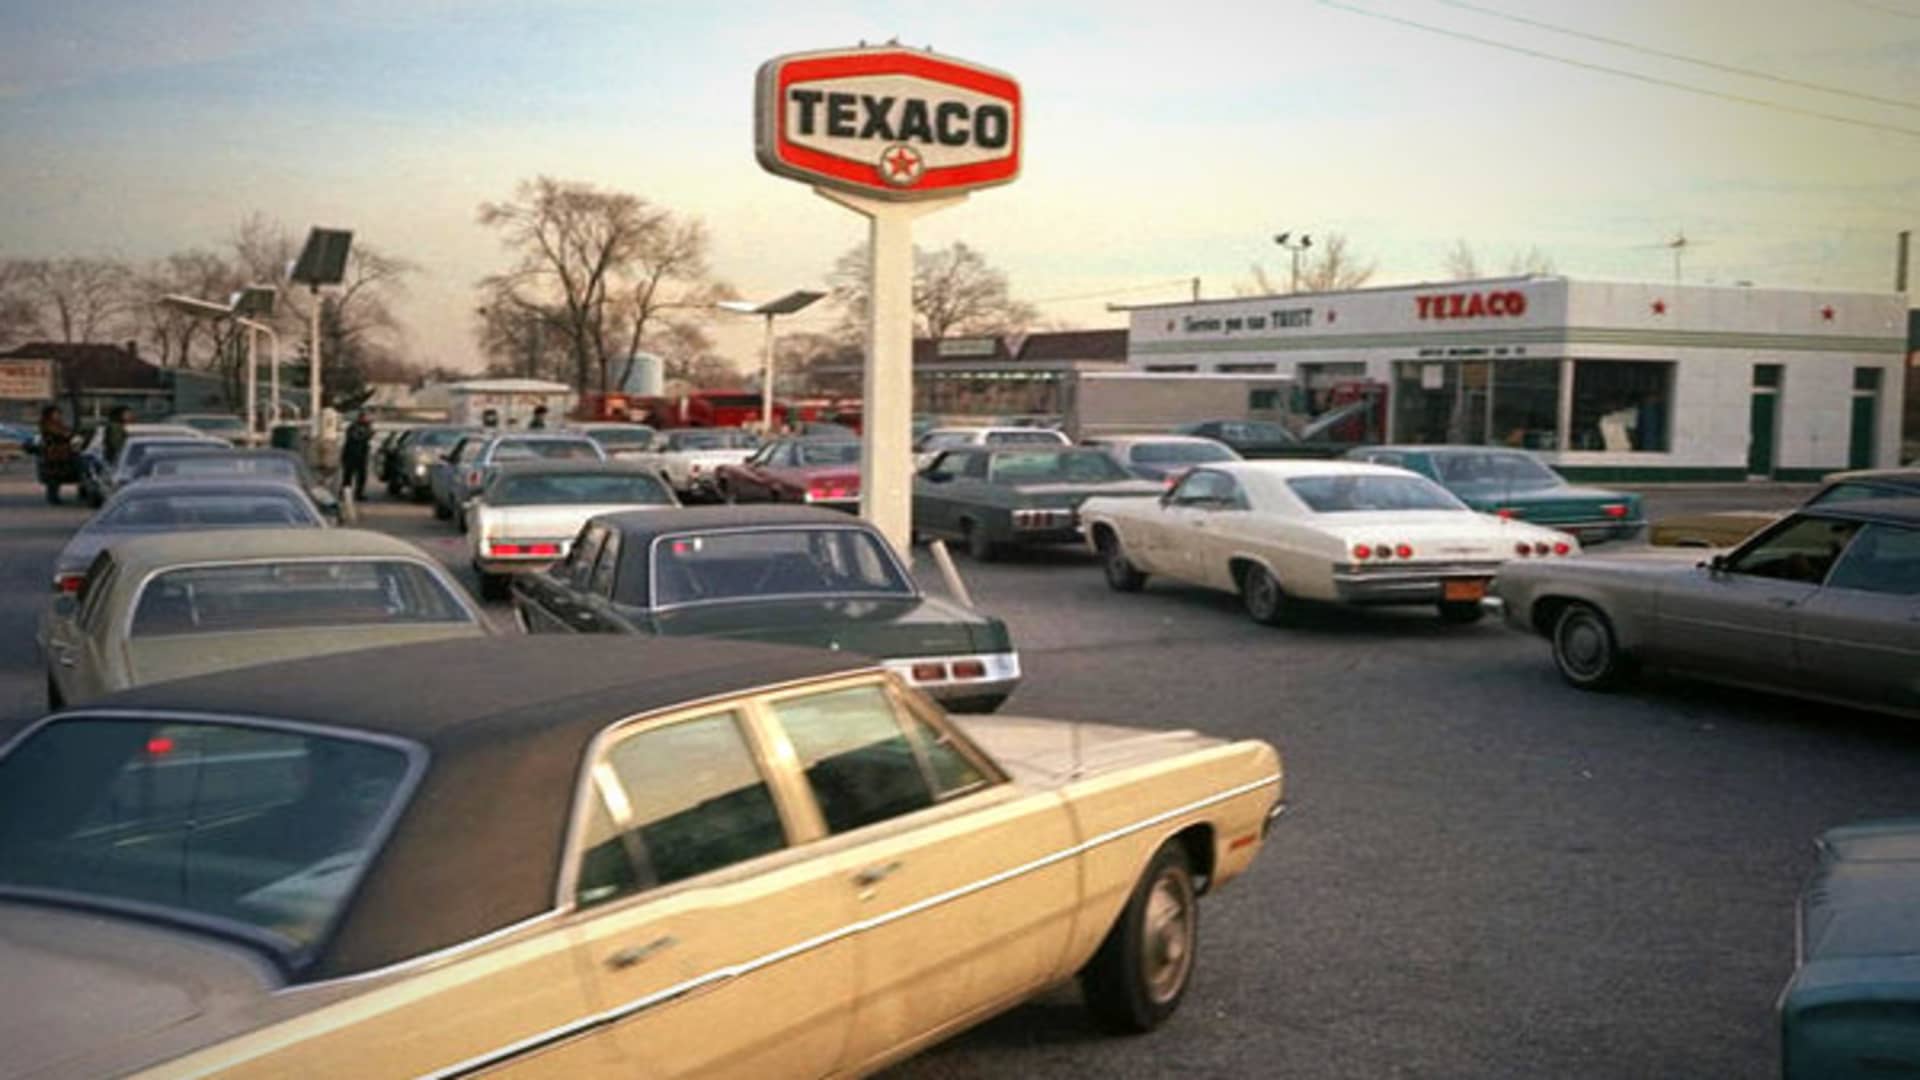
Recent geopolitical tensions have once again cast a shadow over global oil markets, reigniting investor fears of a return to 1970s-style stagflation. The specter of a toxic cocktail of surging inflation and decelerating economic growth, reminiscent of the OPEC oil crisis era, has prompted many to re-evaluate their portfolio strategies. While historical parallels can offer valuable context, a deeper dive into current market dynamics, supported by OilMarketCap’s proprietary data, reveals fundamental differences that distinguish today’s landscape from the challenges of five decades ago. Understanding these nuanced distinctions is crucial for investors positioning themselves in the evolving energy sector and broader financial markets.
Current Market Snapshot: Geopolitical Tensions vs. Supply Fundamentals
The past few weeks have seen significant volatility in crude benchmarks, initially driven by geopolitical flashpoints. However, the market has since shown signs of stabilization, albeit with underlying tension. As of today, Brent Crude trades at $92.99, reflecting a slight dip of 0.27% within a daily range of $92.57 to $94.21. WTI Crude mirrors this sentiment at $89.44, also down 0.26% over the last 24 hours. This current stability, however, follows a significant retreat, with Brent having declined over 7% from $101.16 on April 1st to $94.09 by April 21st. This downward correction, despite ongoing geopolitical risks, underscores the market’s evolving sensitivity to actual supply-demand fundamentals rather than just headline fears. While the initial spike fueled comparisons to past crises, the subsequent price action suggests that the underlying market structure and supply resilience are playing a more dominant role than in the highly vulnerable 1970s. Gasoline prices also show a slight softening, currently at $3.11, down 0.64%.
The U.S. as a Global Energy Anchor: A Modern Divergence
A recurring question from our investor base, as highlighted by proprietary reader intent data, often revolves around the trajectory of crude prices, with many asking “is WTI going up or down?” and seeking predictions for oil prices by the end of 2026. A critical factor influencing these dynamics, and a stark contrast to the 1970s, is the United States’ transformation into a dominant global energy producer and a top crude exporter. This fundamental shift significantly alters the global supply equation and, crucially, the U.S. economy’s vulnerability to Middle Eastern supply disruptions. In the 1970s, the U.S. was a net importer, highly susceptible to OPEC’s strategic maneuvers. Today, robust domestic production acts as a substantial buffer, insulating the U.S. economy and, by extension, the dollar, from the full impact of overseas supply shocks. This energy independence strengthens the U.S. dollar, which, as observed recently, has not weakened despite oil price fluctuations. Unlike the 1973 scenario where a weaker dollar fueled spectacular gold gains alongside oil, the current strength of the dollar means that gold, while still a hedge against uncertainty, does not necessarily track oil prices in the same manner. This dynamic fundamentally shifts the traditional portfolio hedges against energy-induced inflation, requiring investors to reconsider their allocation strategies.
Beyond Historical Parallels: Understanding Modern Market Structure
While the echoes of 1970s stagflation are easy to hear amidst market anxiety, a closer examination reveals that the underlying economic conditions and policy frameworks are markedly different today. We are not currently experiencing entrenched, runaway inflation well above central bank targets, nor are we witnessing widespread economic stagnation comparable to that era. The policy toolkit available to central banks and governments is also more sophisticated and agile than it was five decades ago. Furthermore, the notion that small-cap stocks would necessarily repeat their 1970s outperformance is predicated on a recovery phase from a brutal market crash that has yet to occur. In the 1970s, small-caps became the best-performing asset class for three consecutive years (1975-1977) only after the S&P 500 had plummeted by over 40%. While the current environment may not be a replay of the 1970s, it could represent the beginning of a significant regime shift towards a long-overdue repricing of the physical economy and a greater emphasis on hard assets. Investors must distinguish between the symptoms of market stress and the underlying structural differences that define today’s investment landscape.
Key Catalysts and Forward Indicators for Oil Investors
For investors focused on the trajectory of crude prices and the broader energy sector, close attention to upcoming market data and events is paramount. Our proprietary event calendar highlights several key dates in the coming weeks that will offer critical insights into supply-demand balances and production trends. Investors looking for immediate cues should mark their calendars for the EIA Weekly Petroleum Status Reports on April 29th and May 6th, and the API Weekly Crude Inventory reports on April 28th and May 5th. These reports offer vital insights into U.S. crude oil and product inventory levels, refinery activity, and import/export dynamics, which have become increasingly influential given the U.S.’s role as a top global producer. Additionally, the Baker Hughes Rig Count on April 24th and May 1st will provide an indication of drilling activity, offering a forward-looking signal for future production capacity. Perhaps the most significant forward-looking event is the EIA Short-Term Energy Outlook on May 2nd. This comprehensive report will provide updated projections for crude oil prices, production, and consumption through the end of 2026, offering a critical benchmark against which investors can assess their own year-end price predictions and refine their investment strategies. Monitoring these data points will be far more indicative of future market direction than relying solely on historical analogies.