The global oil market is undergoing a significant recalibration, shifting decisively into a bearish phase that promises sustained pressure on crude prices through 2026. This outlook stems from a powerful convergence of expanding supply and weakening demand, creating what we view as a “one-two punch” for energy investors. As OPEC+ continues to unwind its production cuts from the 2020-2024 period, adding millions of barrels to the market, macroeconomic headwinds are simultaneously dampening consumption, particularly in key OECD economies. This fundamental rebalancing suggests that the era of tight supply and elevated prices may be giving way to a new environment characterized by surplus and heightened inventory levels, necessitating a careful re-evaluation of investment strategies in the crude sector.
The Structural Shift: Supply Expansion Meets Demand Deceleration
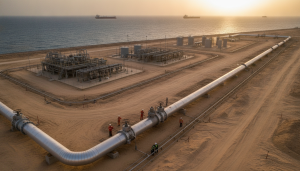
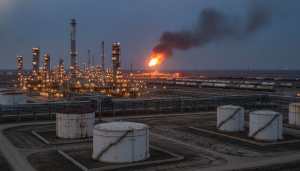
A fundamental transformation is underway in global oil balances, moving from a period of relative tightness to a state of pronounced surplus. The primary driver on the supply side is the gradual but consistent increase in output from OPEC+ nations. This coalition is projected to add approximately 2.5 million barrels per day (bpd) of new supply in the latter half of 2025 as it continues to roll back its previous cuts. Beyond OPEC+, non-OPEC+ producers are also contributing to the expanding supply picture, with countries like the United States, Guyana, Argentina, and Canada demonstrating incremental gains. Specifically, the fourth quarter of 2025 alone is expected to see OPEC+ output rise by 1 million bpd quarter-on-quarter, complemented by an additional 120,000 bpd from the US, despite some indications of shale plateauing. This robust supply expansion directly contrasts with a decelerating demand profile. Global consumption is forecast to drop by 230,000 bpd in Q4 2025, primarily due to weaker seasonal fuel use across OECD economies. This combination of rising supply and cooling demand is set to push global liquids balances into a significant surplus of around 2.2 million bpd in Q4 2025, with crude oil supply alone exceeding demand by over 2.5 million bpd. This structural shift establishes the foundation for sustained price pressure extending well into 2026.
Current Market Realities: Price Corrections Amidst Bearish Sentiment
While the long-term outlook points to sustained pressure, recent market movements already reflect this bearish sentiment. As of today, April 17, 2026, Brent Crude trades at $91.65 per barrel, marking a 2.05% decline within the day, with an intraday range of $91.58 to $93.04. West Texas Intermediate (WTI) Crude mirrors this trend, currently at $88.9, down 2.49% for the day, trading between $88.76 and $90.34. This immediate price action, while still representing historically elevated levels compared to some prior periods, aligns with the broader bearish phase indicated by our proprietary data. Over the past 14 days, Brent has experienced a notable correction, falling from $112.57 on March 27, 2026, to $98.57 on April 16, 2026 – a substantial drop of $14, or 12.4%. This significant downturn underscores the market’s sensitivity to the evolving supply-demand narrative and investor concerns about impending surpluses. The ripple effect is also visible in refined products, with gasoline prices currently at $3.06, down 0.97% today. These recent declines, even from higher starting points, confirm that market participants are actively pricing in the anticipated loosening of global oil balances, setting the stage for potential further downward adjustments as the projected surpluses materialize.
Investor Focus: Decoding OPEC+ Intent and Future Price Signals
Our proprietary reader intent data reveals a keen investor focus on two critical areas this week: the current Brent crude price and, perhaps more tellingly, the specific production quotas of OPEC+. This clearly indicates that market participants are actively trying to reconcile today’s price levels with the strategic decisions of the world’s major oil producers. Investors are asking what OPEC+’s current production quotas are because they understand that the alliance’s output strategy is the most significant variable in determining the depth and duration of the impending market surplus. With OPEC+ projected to add 2.5 million bpd in new supply in H2 2025 and contribute significantly to an annual liquids supply growth of around 2.5 million bpd in 2026, their policy decisions directly impact the global supply-demand equilibrium. If global demand growth remains below 1 million bpd in 2026, as forecasted, the market could face an oversupply exceeding 2 million bpd for the entire year, heavily concentrated in the first half. Therefore, understanding OPEC+’s commitment to these output increases, or any potential deviation, is paramount for investors attempting to model future crude price trajectories and manage their energy portfolios effectively. The current Brent price, while a real-time indicator, is increasingly viewed through the lens of these strategic supply dynamics and the potential for higher stock levels to erode pricing power.
Navigating the Road Ahead: Key Calendar Events and the 2026 Outlook
The path forward for crude prices through 2026 will be heavily influenced by a series of upcoming events and the market’s reaction to mounting inventory levels. Investors should closely monitor the OPEC+ Joint Ministerial Monitoring Committee (JMMC) meeting today, April 17, 2026, followed by the Full Ministerial meeting tomorrow, April 18, 2026. While the current market outlook points to continued supply expansion, any unexpected policy shift or rhetoric from these meetings could introduce volatility. These gatherings are crucial for understanding whether the alliance will maintain its current trajectory of unwinding cuts or if external pressures might prompt a re-evaluation of their strategy in the face of a looming surplus. Beyond OPEC+, weekly data releases will provide vital real-time insights into market fundamentals. The API Weekly Crude Inventory reports on April 21 and April 28, followed by the EIA Weekly Petroleum Status Reports on April 22 and April 29, will offer critical snapshots of US crude stocks – a key indicator of market balance. Similarly, the Baker Hughes Rig Count on April 24 and May 1 will shed light on North American production activity and its potential to exacerbate the supply side. The implications of these dynamics extend well into 2026, which is set to inherit both higher stock levels and looser fundamentals. With annual liquids supply growth of 2.5 million bpd projected against demand growth below 1 million bpd, the market could face an oversupply of more than 2 million bpd. Without significant alterations to OPEC+ strategy or unforeseen reductions in exports from sanctioned nations, this sustained imbalance suggests that the downward pressure on crude prices will remain a dominant theme, challenging investment theses built on supply scarcity.