
(Oil & Gas 360) – Electricity Data For The Month Of March Highlights Why Many Are Likely To Soon Be Caught Very Natural Gas Short

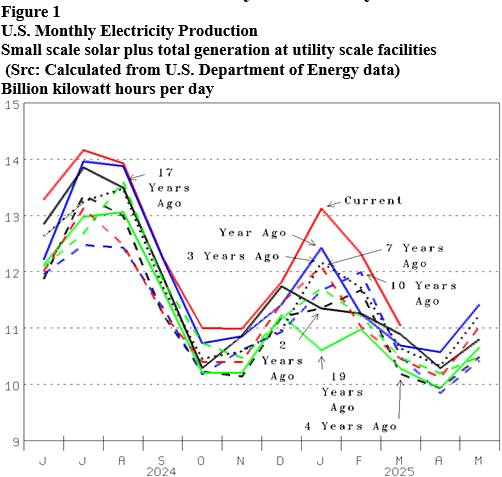
More energy needed to power the much needing to be done had 3.2% more electricity generated in March than last year. Grid connected electricity generation plus small-scale solar averaged 11.030-billion-kilowatt hours per day (Bkwh/d) in March (Figure 1, red line), 0.338 more than 10.692 last year (blue line) a 3.2% year-over-year (YOY) increase. It is another record high quantity needed highlighting the economy growing.
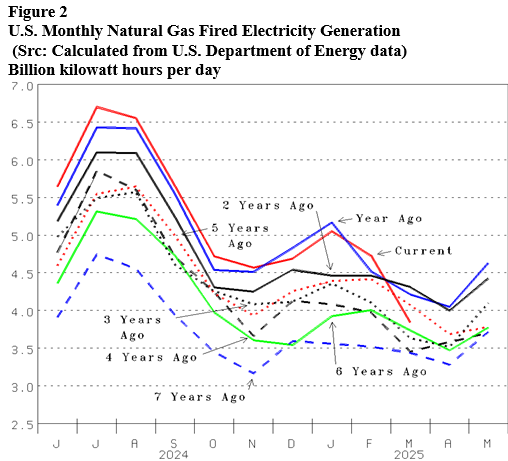
While the quantity of electricity generated was a 0.338 Bkwh/d YOY increase, the quantity generated by natural gas was a 0.377 YOY decline. The quantity of electricity fueled by natural gas set new record highs 9 of the last 12 months (Figure 2. However, 3.836 Bkwh/d generated in March (red line) was a significant 0.890 decline from February and 0.472 less than the March record high set in 2023 (bold line). It was a 0.377 decline (-8.9%) versus 4.213 last March (blue line).
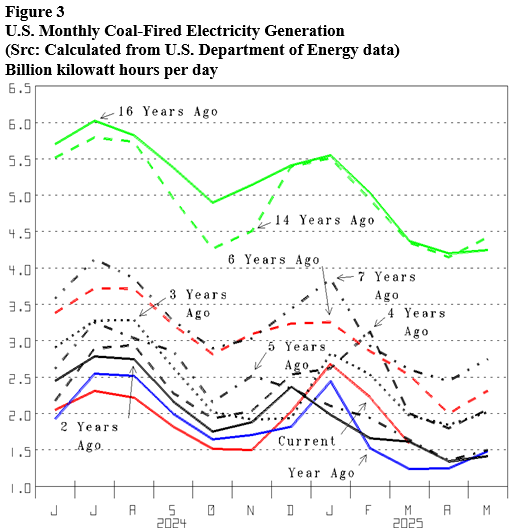
Natural gas generation down 0.338 Bkwh/d YOY occurred because coal-fueled generation increased 0.347 YOY. Coal electricity generation switched from setting new, many-years new lows (Figure 3, red line) to YOY increase in December (versus blue line). 1.585 Bkwh/d generated in March is 0.347 more than the 1.238 generated in March last year, which was the lowest quantity generated by coal since the 1960s. We credit the increases to The Climate Changing to colder and the parts of the country most colder Blessed to have significant coal-fired electric generating capacity.
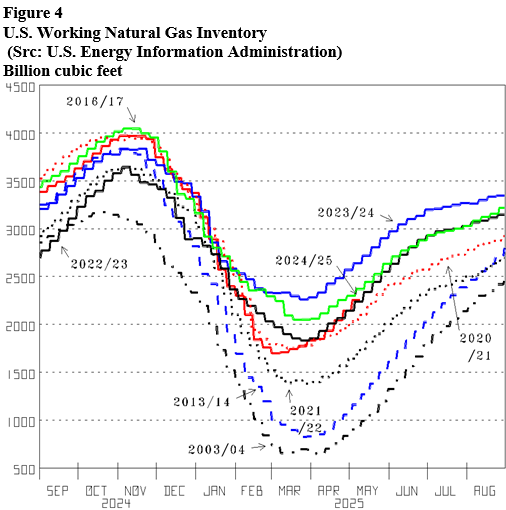
Natural gas inventory low would be significantly lower were it not for coal’s notable YOY increases January through March. The cold-air episodes this past Winter changed working natural gas inventory from up at 3,932 Bcf November 1 (Figure 4, red line), 157 Bcf more than the year before (blue line) to being 1,698 Bcf March 7, 230 less than last year. And that despite notably more electricity generated by coal in January and February (Figure 3). We estimate that 82 Bcf remained in inventory during March because 0.377 Bkwh/d less was generated by natural gas in March. Instead of 1,780 Bcf in inventory March 31, 1,698 would be the number and 2,293 could be the level May 16th, 415 Bcf less than last year.
By oilandgas360.com contributor Michael Smolinksi with Energy Directions
The views expressed in this article are solely those of the author and do not necessarily reflect the opinions of Oil & Gas 360. Please consult with a professional before making any decisions based on the information provided here. The information presented in this article is not intended as financial advice. Contact Energy Directions for the full report. Please conduct your own research before making any investment decisions.