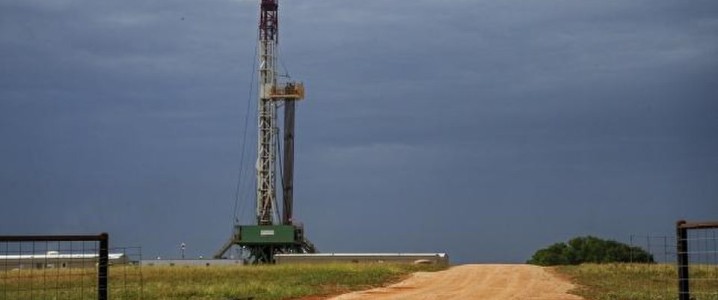
The latest US drilling activity data reveals a curious contradiction for energy investors. While the total number of active rigs for oil and gas in the United States saw a modest uptick this week, signaling a potential response to earlier price strength, the current crude oil market tells a starkly different story. Far from an environment fueled by a price rally, we are now navigating a significant market correction. This divergence demands a deeper dive into the underlying dynamics of US shale, global supply-demand fundamentals, and the critical events on the immediate horizon that will shape investor sentiment and capital allocation in the coming weeks.
The Disconnect Between Rig Activity and Current Price Action
Recent reports indicated that the total US rig count rose to 550, with active oil rigs increasing by 2 to reach 420. This incremental rise might suggest producers are responding to past price signals, but the present market reality challenges any notion of a sustained “rally.” As of today, Brent crude trades at $90.38 per barrel, representing a sharp 9.07% decline on the day. This is a dramatic shift, especially when considering the 14-day trend: Brent has plummeted from $112.78 on March 30th, experiencing a substantial $22.40 drop, or nearly 20% of its value. WTI crude mirrors this downturn, currently trading at $82.59 per barrel, down 9.41% today. This severe price correction, coupled with gasoline prices at $2.93 and down over 5% today, indicates a broad-based bearish sentiment in the energy complex. For investors, this creates a critical disconnect: is the recent rig count increase a lagging indicator of past market conditions, or a premature expansion that will soon be curtailed by current price volatility?
Decoding US Drilling Activity: More Nuance Than Meets the Eye
A closer look at the drilling statistics reveals a more complex picture than a simple week-over-week increase. While the total US rig count climbed to 550 and oil rigs edged up to 420, it’s crucial to contextualize these numbers against year-ago levels. The total rig count remains down by 35 from this time last year, and active oil rigs are still 60 units below their year-ago peak. This suggests a longer-term contraction in drilling activity despite the recent weekly bump. Gas rigs, however, held steady at 121, notably 20 units above their count from last year, highlighting a divergent trend between oil and natural gas drilling. Furthermore, the Primary Vision’s Frac Spread Count, a key indicator of well completion activity, remained flat at 175 for the second consecutive week, a figure that is down 26 from the beginning of the year. This suggests that while some drilling may be occurring, the pace of bringing new wells online is not accelerating. Adding to the complexity, the key Permian Basin saw its rig count fall by 1 to 250, marking a significant 54-rig decline from year-ago levels. The Eagle Ford also dropped by 1 rig to 43, 6 fewer than last year. These regional declines in prolific basins, contrasted with the slight overall US increase, point to localized challenges or a strategic shift by operators. Meanwhile, the latest EIA data showed a slight dip in weekly U.S. crude oil production to 13.629 million barrels per day, down from a record high of 13.636 million bpd. This minor production dip, alongside the mixed rig count signals and flat frac spread, indicates that the path to increased US crude supply is far from linear and highly sensitive to market conditions.
Investor Focus Shifts: Navigating Volatility and Future Supply
With crude oil prices experiencing such a dramatic decline, investor attention is firmly fixed on what comes next. A common question we observe our readers asking is: “What do you predict the price of oil per barrel will be by the end of 2026?” The answer to this, and indeed the trajectory of energy investments, hinges critically on upcoming events. The immediate catalysts are the OPEC+ Joint Ministerial Monitoring Committee (JMMC) Meeting on April 19th, followed swiftly by the full OPEC+ Ministerial Meeting on April 20th. Investors are intensely focused on “what are OPEC+ current production quotas?” and whether the group will maintain, deepen, or even begin to ease their current cuts in light of the recent price slump. A decision to uphold or increase cuts could provide a floor for prices, while any hint of increased supply could exacerbate the current downturn. Beyond OPEC+, the market will keenly watch the next Baker Hughes Rig Count on April 24th and May 1st for indications of how US producers are reacting to the current price environment. Additionally, the API Weekly Crude Inventory reports on April 21st and 28th, along with the EIA Weekly Petroleum Status Reports on April 22nd and 29th, will offer crucial insights into US supply-demand balances. These data points, combined with OPEC+’s stance, will largely dictate whether the current price slide continues or if a stabilization, or even a rebound, is on the cards for the latter half of 2026.
Strategic Implications for Energy Investors
The current market landscape presents both challenges and opportunities for energy investors. The immediate price volatility, exemplified by Brent’s nearly 20% drop in two weeks, underscores the inherent risks in the commodity sector. For companies like Repsol, which some of our readers are asking about their performance in April 2026, the current environment demands strategic agility. The recent, albeit small, increase in US rig count might be interpreted as a sign of underlying producer confidence, but the broader data points to continued caution. The year-over-year decline in total and oil-specific rigs, coupled with flat frac spreads and localized drops in key basins like the Permian, suggests that producers are prioritizing capital discipline and efficiency over aggressive expansion. In a market where prices can swing so dramatically, the ability to operate leanly and generate free cash flow remains paramount. Investors should scrutinize companies’ hedging strategies, balance sheet strength, and commitment to shareholder returns in this volatile environment. The coming weeks, shaped by OPEC+ decisions and subsequent US drilling responses, will be pivotal in determining the investment outlook for the remainder of the year and into 2026. Prudent investors will seek out operators demonstrating resilience, cost control, and a clear path to value creation irrespective of short-term price fluctuations.