The global oil market is once again demonstrating its acute sensitivity to geopolitical instability, with crude benchmarks climbing as widening conflicts in the Middle East elevate fears of significant supply disruptions. For investors, this isn’t merely a headline; it’s a critical recalibration of risk premiums, particularly as tangible attacks on key energy infrastructure and shipping routes create genuine choke points in global supply chains. Understanding the immediate market reactions, the underlying vulnerabilities, and the forward-looking indicators is paramount for navigating this volatile environment.
Geopolitical Escalation: The New Baseline for Crude Volatility
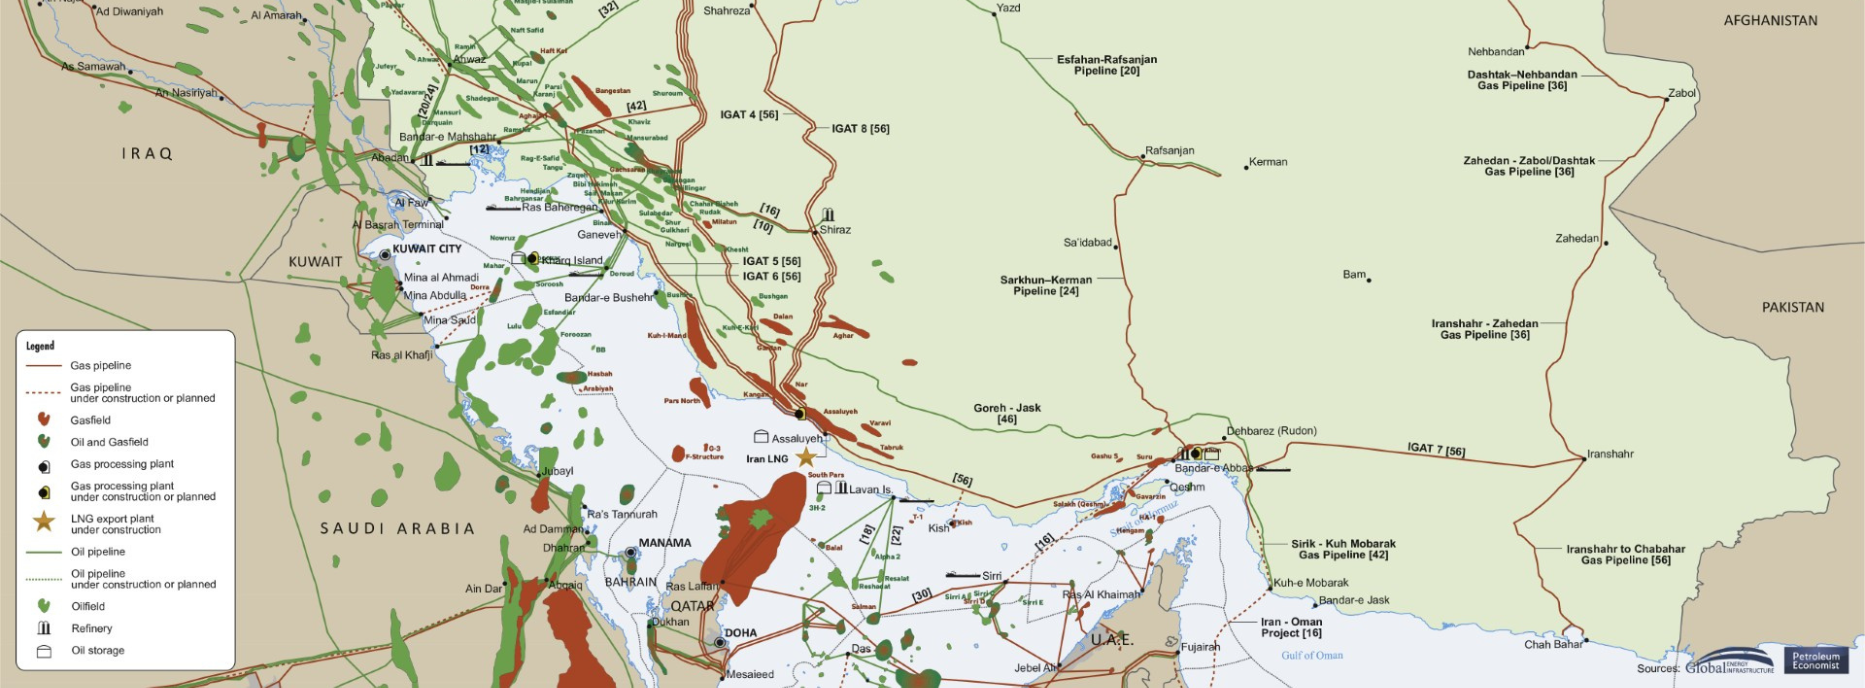
The recent surge in oil prices is directly attributable to an alarming increase in attacks on energy infrastructure across the Middle East, signaling a deepening conflict between the U.S. and Iran. This isn’t just about rhetoric; it’s about physical disruptions impacting millions of barrels per day of refining capacity and crucial maritime transit. Saudi Arabia’s Ras Tanura refinery, a facility capable of processing 550,000 barrels per day, has ceased operations following an attack, removing a significant chunk of processing capacity from the market. While Kuwait’s 350,000 b/d Mina Al-Ahmadi refinery and Oman’s Duqm port reportedly avoided structural damage despite being targeted, the intent to disrupt is clear. Further concerns arise from the UAE, where the Musaffah fuel terminal was struck by a drone, and a persistent fire at the strategic Port of Fujairah, a vital storage and export hub, continues to be monitored closely.
Perhaps the most significant development is the effective halt of ship traffic through the Strait of Hormuz since early March 1, following confirmed strikes on five tankers. This 21-mile-wide chokepoint is a critical artery for global energy, with roughly one-fifth of the world’s daily oil flows transiting its waters. While no mines have been deployed, the elevated risk has paralyzed shipping, leading to a de facto blockade. A prolonged disruption here would not only delay deliveries but would inevitably force upstream production cuts as storage facilities fill up, creating a domino effect across the entire supply chain. The market is now pricing in not just potential supply risks, but an undeniable reality of ongoing, active disruptions.
Current Market Dynamics: A Tense Equilibrium
As of today, Brent Crude is trading at $94.09 per barrel, reflecting a 0.91% gain within a day range of $93.52-$94.21. Similarly, WTI Crude stands at $90.59 per barrel, up 1.03% and oscillating between $89.71 and $90.70. These immediate gains underscore the market’s knee-jerk reaction to escalating tensions. However, it’s crucial for investors to contextualize these daily movements. Our proprietary data indicates that Brent Crude has actually trended down by approximately 7% over the past 14 days, falling from $101.16 on April 1st to today’s $94.09. This recent downtrend, prior to the current geopolitical spike, suggests that underlying demand concerns or perceptions of ample supply may have been exerting downward pressure.
The current upward price correction, therefore, is largely a reflection of a sudden, acute shift in the supply-risk premium rather than a fundamental change in long-term demand outlook. The prompt spread, which measures the difference between immediate and future contract prices, has also reportedly widened, reflecting a tightening in near-term supply conditions. This backwardation signals that traders are willing to pay more for immediate delivery, a classic indicator of perceived scarcity. Gasoline prices, meanwhile, remain stable at $3.13, suggesting that the immediate impact is concentrated on crude supply fears rather than downstream retail demand, though this could quickly change.
Beyond Crude: Refined Products Under Pressure
While the focus often remains on crude benchmarks, investors must not overlook the increasingly precarious state of refined product markets. The Gulf region collectively accounts for approximately 11 million barrels per day of refining capacity, playing a pivotal role in global fuel supply. More specifically, this region has become an indispensable supplier of middle distillates to Europe, especially since sanctions curtailed Russian oil flows and recent refinery closures tightened the market. The attacks on refineries like Ras Tanura and the targeting of major export hubs directly threaten this critical refined product stream.
The market for crude oil may still be considered “relatively well supplied” in a global context, but the refined product sector faces a different reality. With spring maintenance season approaching, typically leading to temporary reductions in refining output, any sustained disruption to Gulf region refineries or their export capabilities could trigger significant volatility in gasoline, diesel, and jet fuel prices. Investors with exposure to refiners or downstream logistics need to pay close attention to the operational status of these facilities and the resilience of alternative supply routes, as the risk of product scarcity is arguably higher than for crude itself.
Navigating the Horizon: Key Data Points and Investor Focus
Our internal reader intent data reveals that investors are keenly focused on the immediate trajectory of WTI, with common queries like “is WTI going up or down” dominating the conversation. This short-term perspective is understandable given the current volatility, but a more comprehensive investment strategy requires anticipating future catalysts. Many are also seeking longer-term guidance, asking “what do you predict the price of oil per barrel will be by end of 2026?” and specific stock-level insights, such as “How well do you think Repsol will end in April 2026.” These questions underscore the need for data-driven foresight.
For the coming weeks, a series of scheduled energy events will provide crucial data points that could either alleviate or intensify market anxieties. This Wednesday, April 22nd, marks the release of the EIA Weekly Petroleum Status Report, which will offer the freshest look at U.S. crude and product inventories – a critical indicator of how well supply is meeting demand domestically. This will be followed by the Baker Hughes Rig Count on Friday, April 24th, providing insight into future U.S. production activity. Looking further ahead, the API Weekly Crude Inventory report on April 28th and another EIA report on April 29th will continue to shape inventory perceptions. Critically, the EIA Short-Term Energy Outlook on May 2nd will offer a more comprehensive forecast on supply, demand, and prices, providing a much-needed longer-term perspective amidst the daily noise. Monitoring these reports for any signs of inventory draws or production shifts will be essential for investors to gauge the actual impact of current disruptions and the potential for a Strategic Petroleum Reserve release, which U.S. officials have hinted at as a measure to ease supply concerns.