
The UK’s solar farms and rooftops generated more electricity than ever before in the first five months of 2025, as the country enjoyed its sunniest spring on record.
The figures, revealed in new Carbon Brief analysis, show that the nation’s solar sites have generated a record 7.6 terawatt hours (TWh) of electricity during January to May 2025.
This is some 42% higher than the 5.4TWh generated in the same period last year, as well as marking a much larger 260% increase in the past decade.
Solar hit a new half-hourly record of 13.2 gigawatts (GW) on 6 April and, for the first time, accounted for more than 10% of monthly electricity generation in two consecutive months (April and May).
The solar electricity generated in 2025 to date has avoided the need to import gas costing around £600m, which would have released 6m tonnes of carbon dioxide (MtCO2) when burned.
However, solar was still only the UK’s sixth-largest source of electricity in 2025 to date, after gas (37TWh), wind (33TWh), imports (18TWh), nuclear (15TWh) and biomass (8.0TWh).
Although this year’s solar high was partly driven by the record sunniest spring, it was also aided by rising capacity, which reached 20.2GW in 2024, up by 2.3GW from 17.9GW a year earlier.
Solar capacity is set to reach at least 45GW by 2030 as part of the government’s ambition to decarbonise the power sector and become a “clean-energy superpower”.
(This article refers to the UK throughout, but the electricity generation data only covers the island of Great Britain. Northern Ireland is part of the all-Ireland electricity system.)
Solar record
The leap in solar output in 2025 saw generation reaching a record 7.6TWh in the first five months of the year, up 42% year-on-year.
Electricity output from UK solar installations saw particularly big jumps in March – where the 2,320 megawatts (MW) average was up 66% from a year earlier – and in April (3,189MW, up 53%).
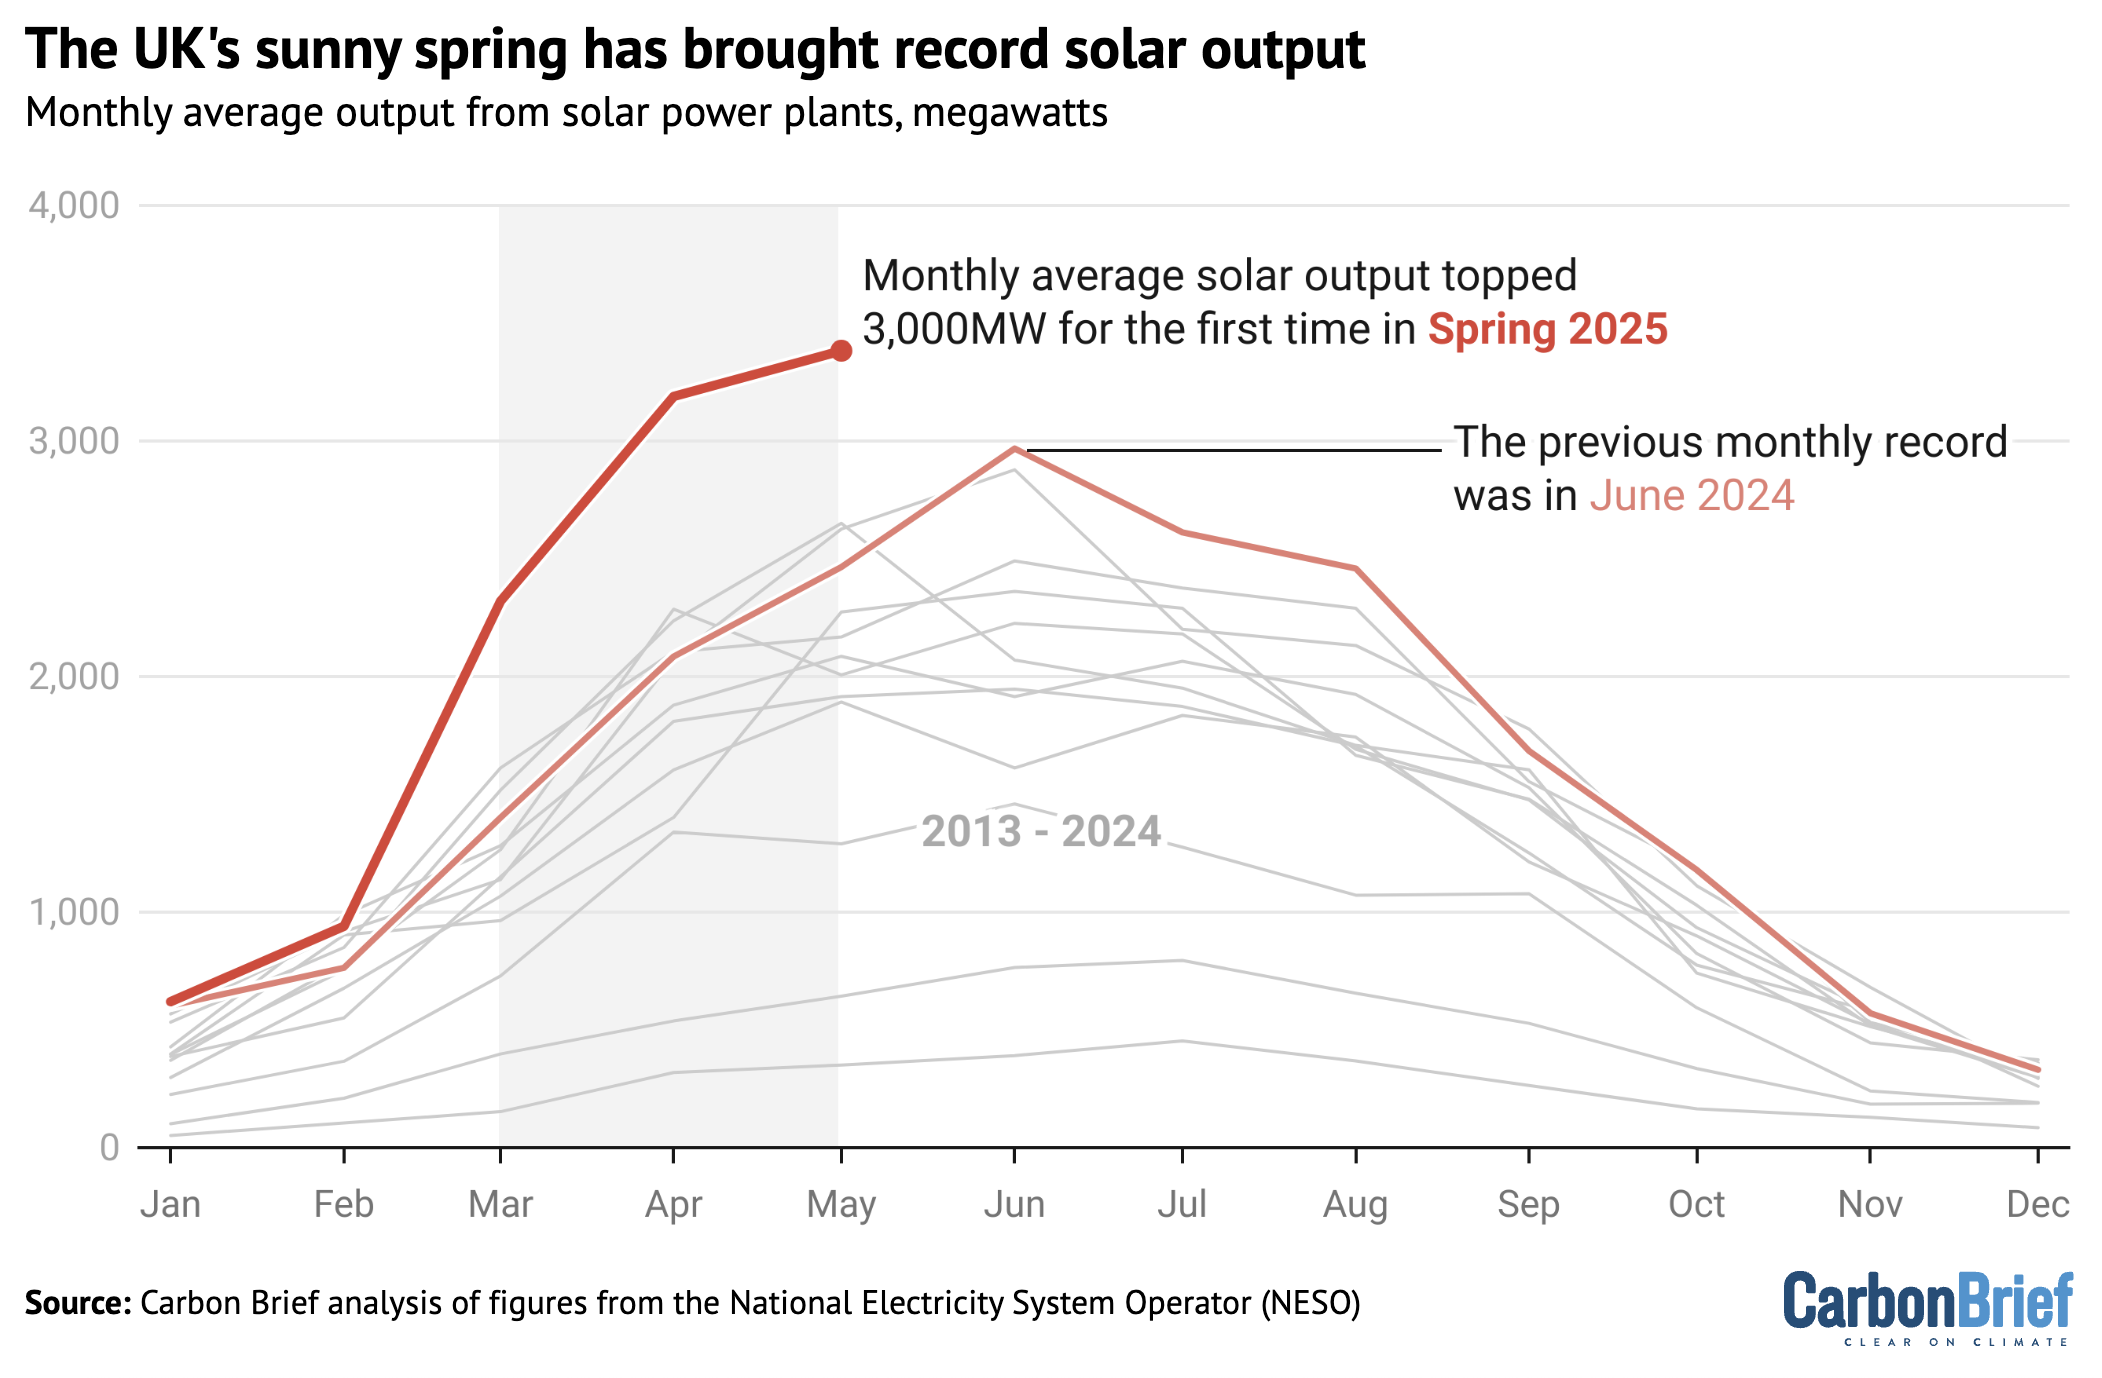
There was a more modest 37% year-on-year increase in May 2025 – the country’s second-sunniest May on record – with average output reaching a new monthly high of 3,383MW.
The amount of electricity generated from solar also hit a new high of 2.5TWh in May 2025, beating April 2025’s 2.3TWh into second place. The previous record of 2.1TWh was set in June 2024.
The figure below shows the average monthly output of the UK’s solar capacity, in MW. Output dips in the short, dark days of winter and generally peaks with the longer daylight hours in June.
(The differences between installed electricity generating capacity, actual power output at any given moment and the amount of electricity generated per hour/day/month/year can cause confusion. The UK’s installed solar capacity reached 20GW at the end of last year. This is the maximum amount of power that could theoretically be produced at one time. In practice, the maximum power output recorded to date is 13GW and the average across a full month reached just over 3GW in May, generating 2.5TWh of electricity.)
The electricity generated by the UK’s solar panels in the first five months of 2025 – at 7.5TWh – is enough to have offset the need for around 16TWh of imported gas.
Buying this gas would have cost around £600m – based on recent average wholesale prices – and burning it would have resulted in roughly 6MtCO2, adding nearly 2% to total UK emissions.
The 16TWh of avoided gas imports is equivalent to 10% of the UK’s net gas imports in the same period last year – or around 10 individual Q-Max liquified natural gas (LNG) tankers, the largest currently available.
(For comparison, the UK only took 24 LNG deliveries during April to September 2024, according to data provider Argus. Figures for the first five months of last year are not available.)
The total amount of electricity generated by solar determines how many deliveries of imported gas can be avoided each month, as well as how far the power sector can cut its emissions.
In total, solar accounted for 11.6% of UK electricity generation in May 2025, only the fourth time it has ever breached the 10% threshold, after June 2023, June 2024 and April 2025.
(Solar topped 10% of monthly global electricity generation for the first time in April this year.)
However, the impact on the electricity market depends more closely on the hour-to-hour and day-to-day variations in solar generation due to the weather, seasons and diurnal cycles.
The highest UK solar output on record was reached at 13:00 on 6 April, when the technology was delivering 13.2GW of power and meeting 40% of demand for that half-hour period.
Sunniest spring
The UK saw 653 hours of sunshine in the period from 1 March to 31 May 2025, making it the sunniest spring since records began in 1910, according to the Met Office.
This total is 43% higher than the average for 1961-90. Before this year, the previous record for the sunniest spring had been set in 2020, when there were 626 sunshine hours.
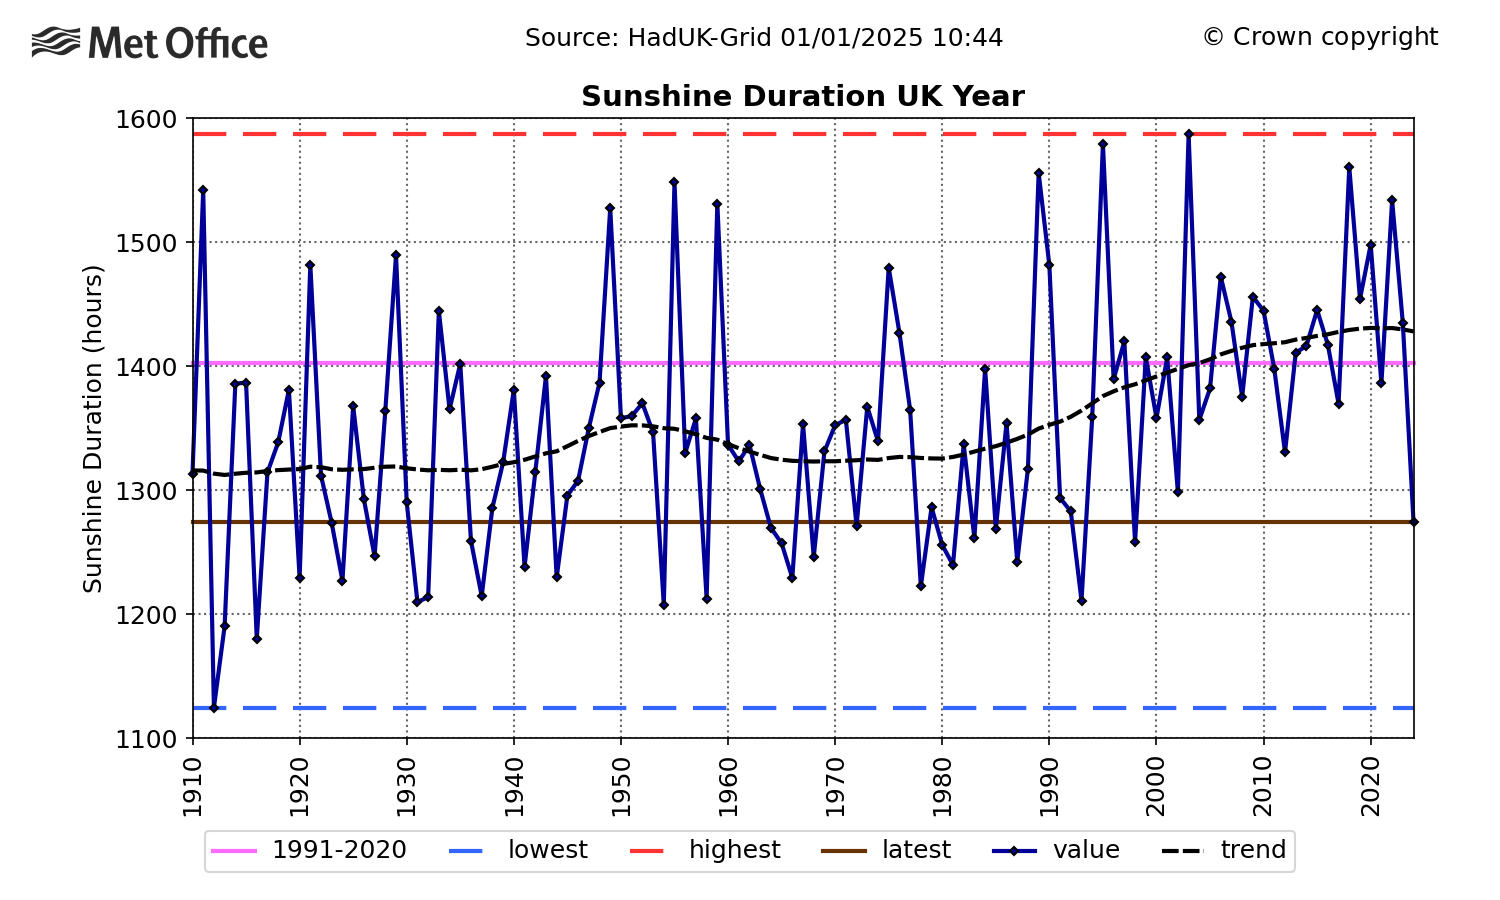
UK sunshine hours have been on an increasing trend, particularly since the 1980s, according to Met Office analysis for Carbon Brief and illustrated in the chart below, which does not cover 2025.
The analysis found that, on average, spring months had been around 15% sunnier over the past decade than during the reference period from 1961-90.
(The analysis put this trend down to a combination of natural variability, changing circulation patterns and possible human influence from shifts in aerosol pollution.)
In a statement announcing the sunniest spring, Met Office scientist Emily Carlisle said: “Seven of the top ten sunniest springs on record for the UK since 1910 have occurred since the year 2000.”
A further Met Office release notes that spring 2025 is not only the sunniest spring on record, but also the fourth-sunniest season overall, with only three summers having had more sunshine.
The extra sunshine this spring contributed to unusually high solar power output per unit of installed capacity, a metric known as the “capacity factor” of the UK’s solar plants.
The capacity factor is a percentage, showing the actual electricity generation relative to the maximum theoretical output, if the panels were working at full capacity all of the time.
Clean power
While sunny weather helped drive the new highs for solar this spring, the UK’s growing capacity also contributed to the records.
After stagnating at around 12-14GW for several years after the then-Conservative government’s decision to end subsidies for solar in 2015, the UK’s installed capacity has since leapt to 20.2GW as of the end of 2024.
Capacity has grown as prices have fallen – boosting the economic case for solar – and as projects with newer “contracts for difference” have started to get built.
Early 2025 has seen the strongest start to the year since 2012 in terms of new rooftop solar capacity. Moreover, the UK is expected to add 3-3.5GW of new solar capacity across 2025 as a whole, according to Solar Media Market Research, up from the 2.3GW added in 2024.
Since taking office last July, energy secretary Ed Miliband has approved around 3GW of new solar capacity at giant sites, including the 500MW Heckington Fen and 500MW Gate Burton schemes.
The government is targeting 45-47GW of solar by 2030 as part of its “mission” to become a “clean-energy superpower”, which aims to have low-carbon sources meeting 100% of UK electricity demand and at least 95% of generation in the country.
Before then, the National Energy System Operator (NESO) is aiming to run the electricity system without fossil fuels for a short period, at some point this year.
Since setting itself this target in 2019, NESO has been making preparations by contracting for zero-carbon sources of grid stability services. These include “inertia” and voltage control, which have traditionally only been offered by conventional fossil-fuel generators.
Only familiar to grid engineers, previously, these terms have recently seen widespread usage in media coverage and finger-pointing over April’s blackouts in Spain and Portugal.
The increase in electricity generation from variable sources, such as wind and solar, brings new technical and market-related challenges, including increasing periods of “negative pricing”.
However, the solutions to these challenges are well-known and already being implemented in the UK. These include the buildout of battery storage systems, increasing interconnector capacity linking the national grid to other countries and new sources of grid stability, such as flywheels.
This article was written by Simon Evans. Data analysis was carried out by Ho Woo Nam. Visuals by Tom Prater.