
Coal power generation fell in both China and India in 2025, the first simultaneous drop in half a century, after each nation added record amounts of clean energy.
The new analysis for Carbon Brief shows that electricity generation from coal in India fell by 3.0% year-on-year (57 terawatt hours, TWh) and in China by 1.6% (58TWh).
The last time both countries registered a drop in coal power output was in 1973.
The fall in 2025 is a sign of things to come, as both countries added a record amount of new clean-power generation last year, which was more than sufficient to meet rising demand.
Both countries now have the preconditions in place for peaking coal-fired power, if China is able to sustain clean-energy growth and India meets its renewable energy targets.
These shifts have international implications, as the power sectors of these two countries drove 93% of the rise in global carbon dioxide (CO2) emissions from 2015-2024.
While many challenges remain, the decline in their coal-power output marks a historic moment, which could help lead to a peak in global emissions.
Double drop
The new analysis shows that power generation from coal fell by 1.6% in China and by 3.0% in India in 2025, as non-fossil energy sources grew quickly enough in both countries to cover electricity consumption growth. This is illustrated in the figure below.
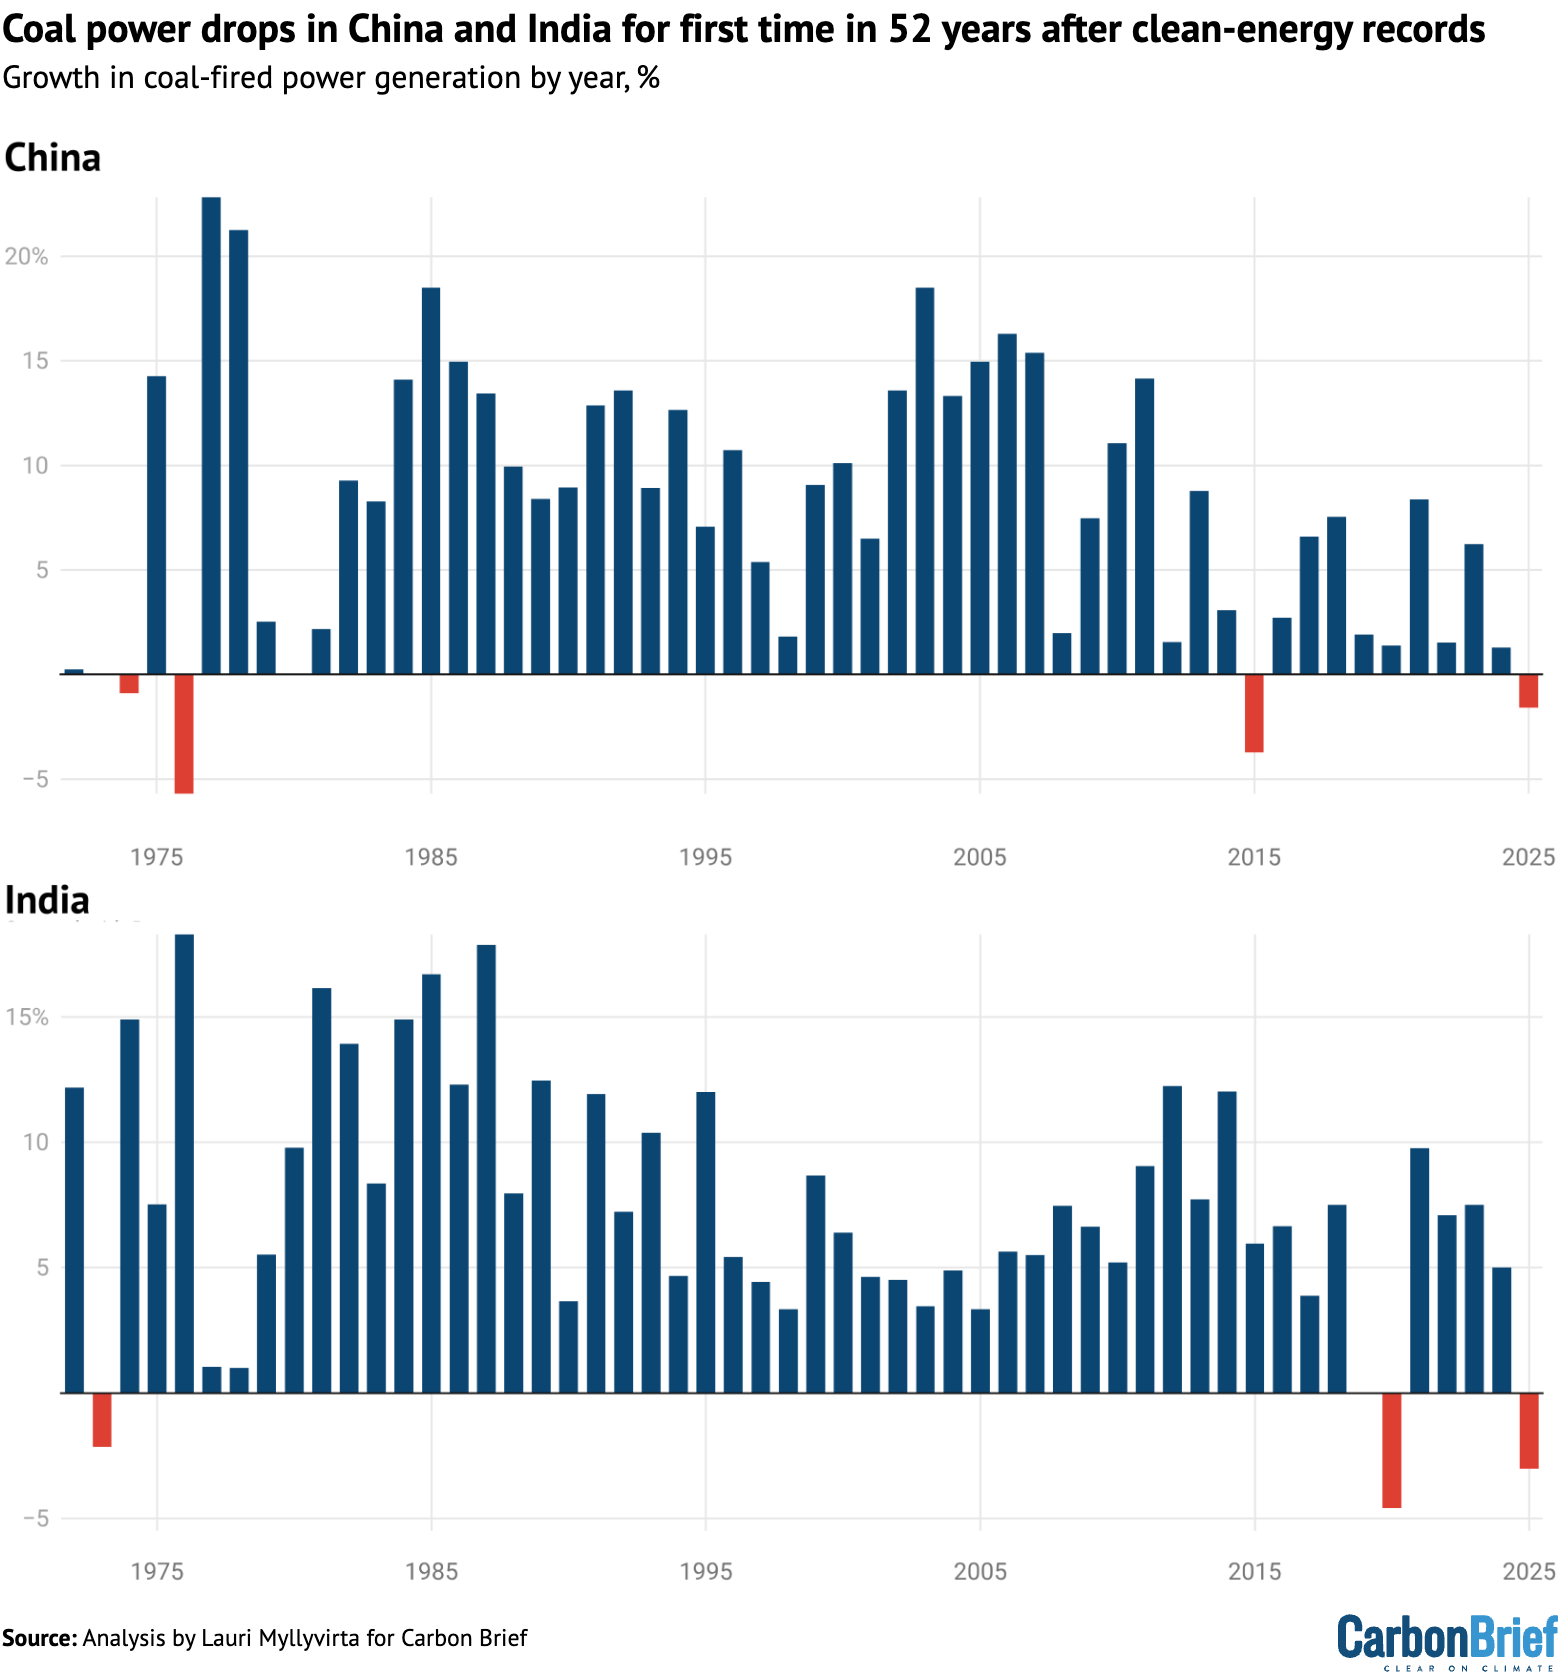
Growth in coal-fired power generation in China and India by year, %, 1972-2025. Source: Analysis by Lauri Myllyvirta for Carbon Brief. Further details below.
China achieved this feat even as electricity demand growth remained rapid at 5% year-on-year. In India, the drop in coal was due to record clean-energy growth combined with slower demand growth, resulting from mild weather and a longer-term slowdown.
The simultaneous drop for coal power in both countries in 2025 is the first since 1973, when much of the world was rocked by the oil crisis. Both China and India saw weak power demand growth that year, combined with increases in power generation from other sources – hydro and nuclear in the case of India and oil in the case of China.
China’s recent clean-energy generation growth, if sustained, is already sufficient to secure a peak in coal power. Similarly, India’s clean-energy targets, if they are met, will enable a peak in coal before 2030, even if electricity demand growth accelerates again.
In 2025, China will likely have added more than 300 gigawatts (GW) of solar and 100GW of wind power, both clear new records for China and, therefore, for any country ever.
Power generation from solar and wind increased by 450TWh in the first 11 months of the year and nuclear power delivering another 35TWh. This put the growth of non-fossil power generation, excluding hydropower, squarely above the 460TWh increase in demand.
Growth in clean-power generation has kept ahead of demand growth and, as a result, power-sector coal use and CO2 emissions have been falling since early 2024.
Coal use outside the power sector is falling, too, mostly driven by falling output of steel, cement and other construction materials, the largest coal-consuming sectors after power.
In India’s case, the fall in coal-fired power in 2025 was a result of accelerated clean-energy growth, a longer-term slowdown in power demand growth and milder weather, which resulted in a reduction in power demand for air conditioning.
Faster clean-energy growth contributed 44% of the reduction in coal and gas, compared to the trend in 2019-24, while 36% was contributed by milder weather and 20% by slower underlying demand growth. This is the first time that clean-energy growth has played a significant role in driving down India’s coal-fired power generation, as shown below.
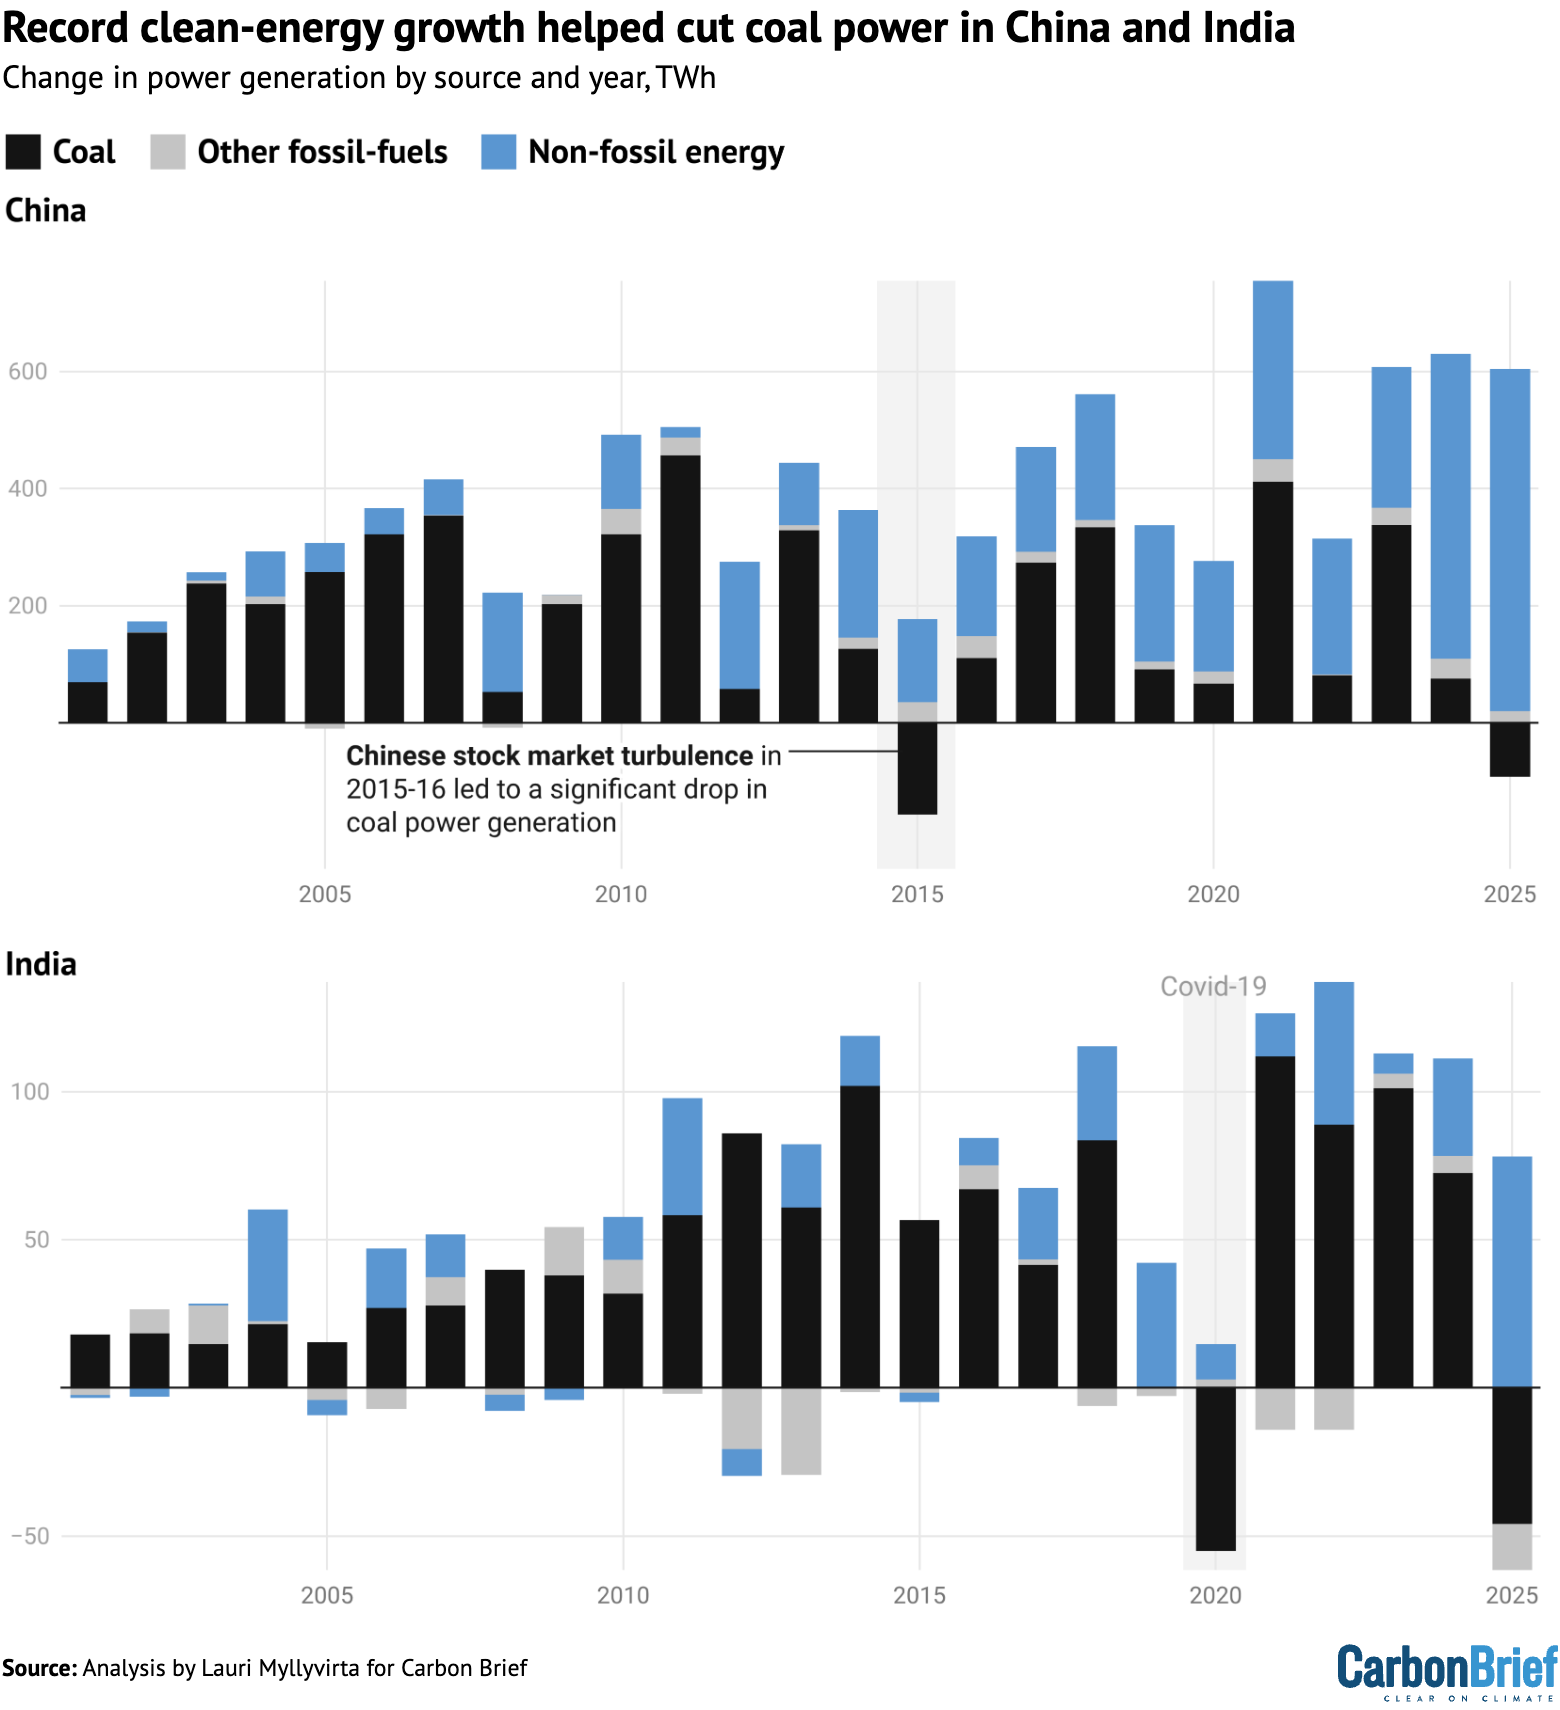
Change in power generation in China and India by source and year, terawatt hours 2000-2025. Source: Analysis by Lauri Myllyvirta for Carbon Brief. Further details below.
India added 35GW of solar, 6GW wind and 3.5GW hydropower in the first 11 months of 2025, with renewable energy capacity additions picking up 44% year-on-year.
Power generation from non-fossil sources grew 71TWh, led by solar at 33TWh, while total generation increased 21TWh, similarly pushing down power generation from coal and gas.
The increase in clean power is, however, below the average demand growth recorded from 2019 to 2024, at 85TWh per year, as well as below the projection for 2026-30.
This means that clean-energy growth would need to accelerate in order for coal power to see a structural peak and decline in output, rather than a short-term blip.
Meeting the government’s target for 500GW of non-fossil power capacity by 2030, set by India’s prime minister Narendra Modi in 2021, requires just such an acceleration.
Historic moment
While the accelerated clean-energy growth in China and India has upended the outlook for their coal use, locking in declines would depend on meeting a series of challenges.
First, the power grids would need to be operated much more flexibly to accommodate increasing renewable shares. This would mean updating old power market structures – built to serve coal-fired power plants – both in China and India.
Second, both countries have continued to add new coal-fired power capacity. In the short term, this is leading to a fall in capacity utilisation – the number of hours each coal unit is able to operate – as power generation from coal falls.
(Both China and India have been adding new coal-power capacity in response to increases in peak electricity demand. This includes rising demand for air conditioning, in part resulting from extreme heat driven by the historical emissions that have caused climate change.)
If under-construction and permitted coal-power projects are completed, they would increase coal-power capacity by 28% in China and 23% in India. Without marked growth in power generation from coal, the utilisation of this capacity would fall significantly, causing financial distress for generators and adding costs for power users.
In the longer term, new coal-power capacity additions would have to be slowed down substantially and retirements accelerated, to make space for further expansion of clean energy in the power system.
Despite these challenges ahead, the drop in coal power and record increase in clean energy in China and India marks a historic moment.
Power generation in these two countries drove more than 90% of the increase in global CO2 emissions from all sources between 2015-2024 – with 78% from China and 16% from India – making their power sectors the key to peaking global emissions.
About the data
China’s coal-fired power generation until November 2025 is calculated from monthly data on the capacity and utilisation of coal-fired power plants from China Electricity Council (CEC), accessed through Wind Financial Terminal.
For December, year-on-year growth is based on a weekly survey of power generation at China’s coal plants by CEC, with data up to 25 December. This data closely predicts CEC numbers for the full month.
Other power generation and capacity data is derived from CEC and National Bureau of Statistics data, following the methodology of CREA’s monthly snapshot of energy and emissions trends in China.
For India, the analysis uses daily power generation data and monthly capacity data from the Central Electricity Authority, accessed through a dashboard published by government thinktank Niti Aayog.
The role of coal-fired power in China and India in driving global CO2 emissions is calculated from the International Energy Agency (IEA) World Energy Balances until 2023, applying default CO2 emission factors from the Intergovernmental Panel on Climate Change.
To extend the calculation to 2024, the year-on-year growth of coal-fired power generation in China and India is taken from the sources above, and the growth of global fossil-fuel CO2 emissions was taken from the Energy Institute’s Statistical Review of World Energy.
The time series of coal-fired power generation since 1971, used to establish the fact that the previous time there was a drop in both countries was 1973, was taken from the IEA World Energy Balances. This dataset uses fiscal years ending in March for India. Calendar-year data was available starting from 2000 from Ember’s yearly electricity data.