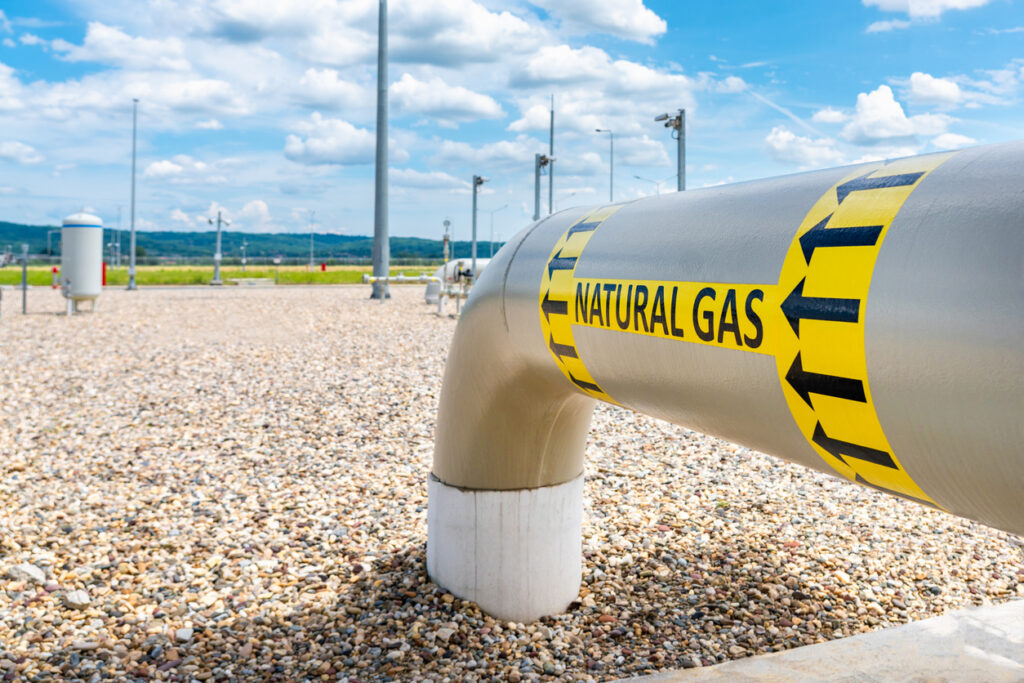
The natural gas market is experiencing a significant uplift, with futures climbing to a one-week high, driven by a powerful confluence of near-record liquefied natural gas (LNG) export volumes and heightened demand forecasts. This bullish momentum, despite otherwise mild seasonal weather across much of the U.S., underscores the increasing global appetite for American gas and the immediate impact of localized weather events. For investors, understanding these interconnected dynamics is crucial for navigating what promises to be a volatile but potentially rewarding energy landscape.
LNG Export Surge and Winter Weather Fueling Gains
The primary catalyst for the recent natural gas price appreciation is the sustained strength in U.S. LNG exports. Data indicates average gas flows to the nine major U.S. LNG export facilities have reached an impressive 18.6 billion cubic feet per day (bcfd) so far this February. This figure surpasses January’s 17.8 bcfd and is on track to eclipse December’s monthly record of 18.5 bcfd, solidifying the U.S. position as the world’s largest LNG exporter. This export prowess, a direct result of increased global demand following supply disruptions, provides a robust floor for domestic gas prices.
Adding to this export-driven demand, a winter storm currently blanketing the U.S. Northeast has injected a temporary but significant boost into heating demand. While broader weather patterns are predicted to normalize by early March, the immediate impact is undeniable. Projections for average gas demand in the Lower 48 states, including exports, show a slight moderation from 137.5 bcfd this week to 130.3 bcfd next week, yet these figures represent an upward revision from prior outlooks, signaling stronger-than-expected consumption. As of today, natural gas futures for March delivery traded at $3.090 per million British thermal units, reflecting a 1.4% gain and marking the contract’s highest close since February 13, a clear indicator of market confidence in these demand drivers.
The Permian Paradox: Waha’s Persistent Discount
Amidst the broader strength in natural gas, a stark divergence persists within the Permian Basin. The Waha Hub in West Texas, a critical nexus for gas associated with the nation’s largest oil production, has seen average prices remain in negative territory for an unprecedented 12th consecutive day. This regional anomaly highlights severe pipeline constraints that effectively trap gas within the basin, forcing producers to pay to dispose of it rather than sell it. Historically, Waha prices closed below zero 17 times in 2019, 6 times in 2020, and once in 2023. However, the situation has escalated dramatically, with 49 negative closes in 2024, 39 in 2025, and already 21 so far this year. The average price at Waha for this year stands at a mere 76 cents per mmBtu, a significant discount compared to $1.15 in 2025 and a five-year average (2021-2025) of $2.88. For investors, this presents a unique challenge and potential opportunity: while it underscores the infrastructure deficit in the Permian, it also fuels the argument for future pipeline expansions that could unlock significant value once completed.
Global Appetite and Investor Sentiment in a Broader Energy Context
The global energy landscape continues to underscore the strategic importance of U.S. natural gas. Around the world, key benchmarks such as the Dutch Title Transfer Facility (TTF) in Europe and the Japan-Korea Marker (JKM) in Asia are trading near $11 per mmBtu. This substantial premium over U.S. domestic prices reinforces the economic incentive for continued LNG exports and the development of new infrastructure. Projects like the QatarEnergy/Exxon Mobil’s 2.4 bcfd Golden Pass export plant in Texas, which is currently taking in increasing feedgas as it prepares for its inaugural LNG production, will only further solidify the U.S. role in meeting this global demand.
Our proprietary reader intent data reveals a keen investor focus on the broader energy market trajectory. Questions like “is WTI going up or down” and “what do you predict the price of oil per barrel will be by end of 2026” indicate a strong desire for clarity on price direction. While natural gas is finding its footing, the crude oil market shows its own dynamics. As of today, Brent crude trades at $93.91 per barrel, marking a 3.85% increase, while WTI crude stands at $90.38 per barrel, up 3.39%. This positive movement for crude comes after a period of significant volatility; our 14-day trend analysis shows Brent crude experienced a notable decline of nearly 20% from $118.35 on March 31 to $94.86 on April 20. This indicates that while gas has a clear bullish narrative from exports and weather, crude is navigating its own set of supply-demand signals and geopolitical influences, keeping investors on edge for future movements.
Navigating Future Volatility: Key Events on the Horizon
Looking forward, the energy market calendar is packed with events that will shape both natural gas and crude oil prices. Investors should closely monitor several upcoming data releases and meetings. Tomorrow, April 21, the OPEC+ Joint Ministerial Monitoring Committee (JMMC) meeting will be a critical determinant for crude oil supply policy. Any indications of production adjustments could significantly impact global crude prices, thereby indirectly influencing associated gas production in regions like the Permian.
Mid-week, on April 22, the U.S. Energy Information Administration (EIA) Weekly Petroleum Status Report will provide fresh insights into crude, gasoline, and distillate inventories, alongside refinery activity and demand indicators. Following this, the Baker Hughes Rig Count on April 24 will offer a crucial gauge of drilling activity, impacting future supply expectations for both oil and gas. These weekly reports, along with subsequent updates on April 28 (API Crude Inventory), April 29 (EIA Weekly), May 1 (Baker Hughes), and May 5 (API Weekly), provide granular data that can sway short-term market sentiment. Further out, the EIA’s Short-Term Energy Outlook on May 2 will offer a comprehensive forecast for supply, demand, and prices across the energy complex, providing a valuable longer-term perspective for strategic investment decisions. The interplay of these events, against a backdrop of rising LNG demand and localized infrastructure challenges, ensures that active management and informed analysis will remain paramount for investors in the energy sector.