The U.S. oil and gas sector continues to present a fascinating paradox for investors: robust crude oil production persisting even as drilling activity declines. This disconnect signals evolving efficiency, strategic capital deployment, and a re-evaluation of traditional supply indicators. For investors navigating today’s complex energy landscape, understanding these underlying dynamics is crucial for identifying opportunities and managing risk. Our latest proprietary data from OilMarketCap.com provides critical insights into market prices, upcoming catalysts, and the questions actively shaping investor sentiment, offering a unique lens through which to analyze these trends.
U.S. Output Resilient Despite Declining Rig Counts
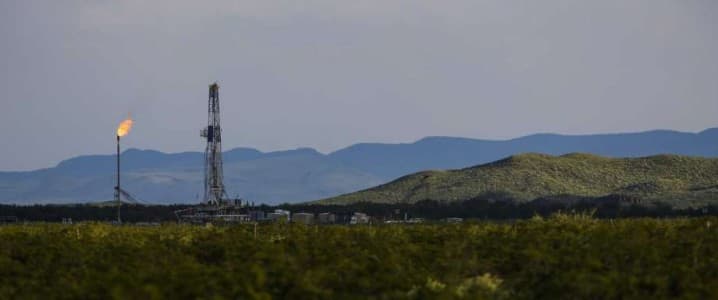
Recent data underscores a compelling narrative of American crude oil resilience. The latest figures show U.S. crude oil production increasing slightly by 2,000 barrels per day (bpd) in the week ending December 26, reaching an average of 13.827 million bpd. This level stands just 26,000 bpd shy of the all-time high achieved only three weeks prior, demonstrating extraordinary output stability. What makes this particularly noteworthy is the backdrop of a shrinking drilling footprint. The total active drilling rig count across the United States currently stands at 546, a marginal increase of 1 rig this week, but a significant 43 rigs below levels seen this time last year. Specifically, oil rigs are down by 70 year-over-year to 412, while gas rigs have increased by 22 to 125. The Permian Basin, a cornerstone of U.S. production, mirrors this trend with 247 active rigs, down 57 from a year ago. Similarly, the Eagle Ford basin saw its rig count slip by 1 to 40, 5 fewer than last year. This divergence between declining rig numbers and steady, high production levels suggests that operators are extracting more from fewer wells, perhaps through enhanced completion techniques, longer laterals, or drawing down drilled but uncompleted (DUC) wells. This efficiency gain challenges conventional wisdom that links immediate supply shifts directly to rig count fluctuations, requiring investors to look deeper into productivity metrics.
Navigating Current Market Volatility Amidst Strong Supply
The robust U.S. supply profile unfolds within a volatile global energy market. As of today, Brent Crude trades at $90.01, reflecting a -0.46% move within a day range of $93.87 to $95.69. Similarly, WTI Crude stands at $86.38, down -1.19% on the day, having traded between $85.5 and $87.49. These figures represent a significant shift from recent peaks. Our proprietary 14-day Brent trend data reveals a sharp correction, moving from $118.35 on March 31st to $94.86 on April 20th, marking a substantial decline of $23.49, or nearly 20%. This pronounced downward trend in crude prices, occurring concurrently with strong U.S. output, signals a complex interplay of factors. While resilient American production adds to global supply, the recent price drop suggests either a softening of demand expectations, a re-evaluation of geopolitical risk premiums, or a combination of both. Investors must carefully weigh the impact of sustained high U.S. production against broader macro-economic indicators and demand projections, particularly as global economic growth forecasts remain a point of contention.
Upcoming Catalysts: What Energy Investors Need to Watch
The coming weeks are packed with pivotal events that will undoubtedly influence energy market dynamics and investor sentiment. Tomorrow, April 21st, the OPEC+ Joint Ministerial Monitoring Committee (JMMC) Meeting is scheduled. Any commentary or indication regarding production quotas from this influential body could send immediate ripples through crude prices. Following closely on April 22nd and again on April 29th, the EIA Weekly Petroleum Status Reports will provide fresh data on U.S. crude inventories, refinery utilization, and product supplied, offering a critical snapshot of domestic supply-demand balances. Significant builds or draws can shift short-term price trajectories. Industry watchers will also be keen on the Baker Hughes Rig Count reports, due on April 24th and May 1st. While the immediate correlation to production may be attenuated by efficiency gains, these reports still provide a proxy for future drilling intentions and capital allocation. Perhaps one of the most anticipated releases for a forward outlook is the EIA Short-Term Energy Outlook (STEO) on May 2nd, which will offer comprehensive projections for global and domestic energy markets. These scheduled events serve as crucial data points for investors to calibrate their positions and anticipate potential market movements.
Addressing Investor Concerns: Price Direction and Future Outlook
Our proprietary reader intent data highlights key questions on the minds of OilMarketCap.com investors this week. A primary concern revolves around the direction of WTI crude prices (“is WTI going up or down?”). Investors are also keenly focused on the broader price outlook for oil per barrel by the end of 2026 and seeking insights into specific company performance, such as Repsol’s potential trajectory. The current market environment, characterized by strong U.S. output contrasting with recent price declines, underscores the complexity of these questions. While resilient domestic supply provides a bearish fundamental, geopolitical tensions, OPEC+ policy, and global demand growth remain powerful bullish or bearish catalysts. Predicting specific price points months or years out is inherently challenging, but our analysis suggests that the market will continue to be driven by the interplay of supply discipline from OPEC+, the ongoing efficiency revolution in U.S. shale, and the pace of global economic recovery. Investors seeking clarity on price direction should closely monitor the upcoming catalysts mentioned above, paying particular attention to inventory builds/draws and any signals from OPEC+ regarding supply management. The ability of U.S. producers to maintain or even increase output with fewer rigs suggests a structural shift that could keep a lid on prices in the absence of significant demand surges or supply disruptions elsewhere.