The Stagnation in US Drilling: A Deeper Dive into Production Dynamics
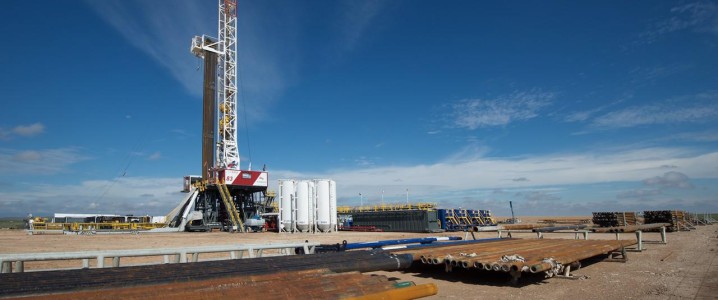
The latest industry data reveals a critical juncture for U.S. oil and gas production, with the total active drilling rig count remaining static this week at 549. This stagnation, reported by Baker Hughes, marks a significant shift from previous growth trajectories and sits 36 rigs below levels seen at this time last year. Drilling activity for crude oil specifically declined, with the number of active oil rigs falling to 422, a notable 57-rig drop year-over-year. This slowdown in oil-focused drilling comes despite a slight uptick in natural gas rigs, which rose by one to 118 active units, representing a 16-rig increase from last year, alongside a marginal rise in miscellaneous rigs to nine.
Regionally, the Permian Basin, a bellwether for U.S. shale, saw its rig count decrease by two to 251, a substantial 53 rigs below its year-ago figure. The Eagle Ford, another prolific region, maintained its rig count at 45, just three fewer than the same period last year. While the overall drilling picture suggests a pause, U.S. crude oil production showed a marginal weekly increase to 13.505 million bpd, according to recent EIA data. However, this figure still leaves average weekly production 57,000 barrels per day short of where it stood at the beginning of the year. Interestingly, Primary Vision’s Frac Spread Count, an indicator of well completion activity, offered a subtle counter-narrative, rising for the fourth consecutive week to 179 crews, 17 above its four-year low. This suggests that while new drilling may be on hold, operators are still actively bringing previously drilled wells online, optimizing existing inventory.
Market Volatility and Investor Concerns Amidst Steep Price Declines
The current market landscape is characterized by significant volatility, directly influencing the cautious approach of U.S. drillers. As of today, Brent Crude is trading at $90.38, experiencing a sharp 9.07% decline within the day, with its price ranging from $86.08 to $98.97. Similarly, WTI Crude has fallen to $82.59, down 9.41% today, fluctuating between $78.97 and $90.34. This immediate downturn is part of a broader trend; our proprietary data indicates Brent Crude has plummeted by nearly 20%, or $22.40, from $112.78 on March 30th to its current $90.38.
Such dramatic price swings inevitably raise critical questions among investors, many of whom are actively asking about the future trajectory of oil prices, specifically what the price per barrel might be by the end of 2026. The substantial and rapid depreciation in crude benchmarks creates an environment of uncertainty, making capital allocation decisions for new drilling projects inherently riskier. This directly impacts the observed stagnation in rig counts. While the market watches for definitive signals, the current bearish sentiment driven by supply-demand dynamics and macroeconomic concerns is a powerful deterrent to aggressive expansion, regardless of the underlying reservoir potential. Gasoline prices are also reflecting this trend, currently at $2.93, down 5.18% today, ranging from $2.82 to $3.1.
Upcoming Catalysts: OPEC+ and Inventory Data in Focus
Forward-looking analysis points to several critical upcoming events that will undoubtedly shape the near-term outlook for crude prices and, by extension, U.S. drilling activity. The most immediate and impactful event is the OPEC+ Full Ministerial Meeting scheduled for this Sunday, April 19th. Investors are keenly focused on what this cartel will decide regarding production quotas, a topic frequently raised by our readers. Given the recent steep decline in oil prices, the market will be scrutinizing whether OPEC+ opts to maintain current output levels, deepen existing cuts to stabilize prices, or potentially surprise with a shift in strategy.
Beyond OPEC+, the coming weeks will offer further insights into market fundamentals through key inventory data releases. The API Weekly Crude Inventory report is due on Tuesday, April 21st, followed by the authoritative EIA Weekly Petroleum Status Report on Wednesday, April 22nd. These reports provide vital context on U.S. supply and demand dynamics, directly influencing price stability. Another installment of the Baker Hughes Rig Count will be released on Friday, April 24th, offering an updated snapshot of drilling activity and whether the current stagnation persists or begins to show signs of movement. Investors will need to closely monitor these events, as any significant shifts in supply policy or inventory levels could trigger substantial market reactions, either reinforcing or reversing the current bearish trend.
Investment Implications: Navigating a Shifting Landscape
For oil and gas investors, the current environment demands a nuanced approach. The stagnation in U.S. drilling, particularly for oil, suggests that E&P companies are prioritizing capital discipline and free cash flow over aggressive production growth in the face of price volatility. While the slight increase in frac spreads indicates continued well completions, the lack of new drilling starts limits the future supply pipeline. This dynamic could lead to a tighter market once existing inventory is worked through, provided demand remains robust.
The dramatic price movements, exemplified by Brent’s nearly 20% drop in two weeks, underscores the inherent risks in the sector. Investors asking about long-term oil price predictions for the end of 2026 should recognize that the path will be heavily influenced by the interplay of OPEC+ decisions, global economic health, and the U.S. shale response. The shift towards natural gas drilling, even if minor, could also signal a strategic reallocation of capital by some operators, potentially driven by more stable gas prices or integrated energy transition strategies. Successful navigation of this landscape will require vigilant monitoring of OPEC+ statements, weekly inventory reports, and the evolving trends in both drilling and completion activity, as these factors collectively dictate the supply-demand balance and, ultimately, the profitability of energy investments.