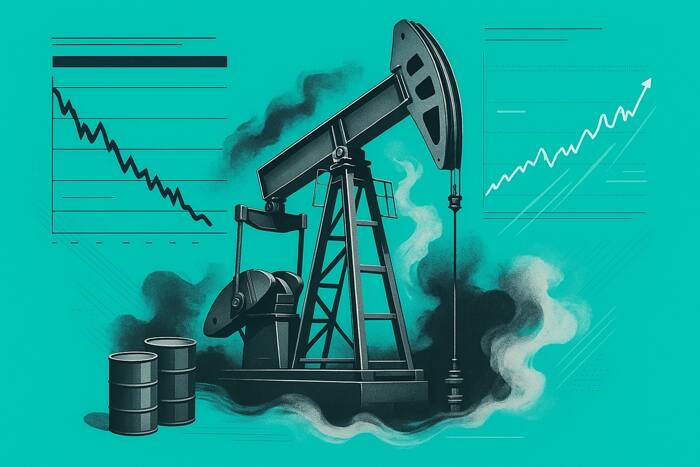
Navigating the Volatile Crude Market: Beyond the 200-Day MA
The global oil market is a complex tapestry of technical signals, fundamental demand drivers, and geopolitical flashpoints, often sending mixed signals to investors. As of today, Brent Crude trades at $90.38, marking a significant daily decline of 9.07%, while WTI Crude mirrors this volatility at $82.59, down 9.41%. This sharp downturn comes despite recent data suggesting robust underlying demand, creating a fascinating divergence for energy investors. While the 200-day moving average at $63.26 remains a crucial long-term technical benchmark, the immediate market action sees crude prices operating well above this level. The current challenge isn’t breaching this historical barrier from below, but rather navigating a market that has recently shed over 18% from its late March highs of $112.78, now testing new support levels in the face of macro uncertainty and a shifting geopolitical landscape. Understanding these dynamics is key to positioning for the coming weeks.
Technical Reassessment: Current Prices vs. Long-Term Indicators
While the 200-day moving average at $63.26 is a foundational technical marker, signaling long-term trend direction and potential deep support, the current market reality places Brent and WTI significantly above this level. The notion of a “breakout” above $63.26, as discussed in some analyses, has already occurred months ago, underscoring how quickly market conditions can evolve. Today’s focus for traders is on the more immediate and higher-tier support and resistance levels. The dramatic daily drops, with Brent shedding over $9 and WTI over $8, signal a significant re-evaluation of short-term price ceilings and floors. The 14-day trend for Brent, which saw prices fall from $112.78 on March 30 to $91.87 just yesterday, points to strong downward momentum that could see tests of further support. For investors eyeing the bigger picture, a retest of the $63.26 200-day MA would indicate a profound shift in market sentiment, signaling a severe downturn from current levels and a potential return to a more bearish long-term outlook. However, for now, the struggle is to stabilize above the current range’s lower bound, with yesterday’s Brent closing price of $91.87 already breached.
EIA Inventory Draws: Bullish Signal or Masked Weakness?
Last week’s U.S. Energy Information Administration (EIA) report delivered a seemingly strong bullish signal: a sharper-than-expected 6 million barrel drawdown in crude inventories. This figure significantly surpassed the forecasted 1.8 million-barrel decline, bringing total crude stocks down to 420.7 million barrels and theoretically pointing to robust demand. However, the picture isn’t entirely clear. Proprietary analysis of reader questions reveals that investors are keenly interested in the true nature of market demand, often asking “what do you predict the price of oil per barrel will be by end of 2026?” The nuance here is critical: a reported rise in Cushing inventories and observations from industry analysts suggest that the substantial draw might be influenced by increased refinery runs and stronger export flows, potentially masking a softer underlying consumption trend. This creates a challenging interpretative landscape for investors, where headline figures require deeper scrutiny to ascertain genuine demand strength versus temporary logistical or refining dynamics.
Geopolitical Tensions: The Unquantifiable Risk Premium
Geopolitical risks continue to inject an unquantifiable premium into crude prices, a factor that consistently vexes investor attempts at precise price predictions. The ongoing situation between Russia and Ukraine remains a major overhang, with Russia dismissing any peace negotiations that exclude Moscow as “a road to nowhere.” This rhetoric ensures that the supply uncertainty from a major producer persists. Adding another layer of complexity, the U.S. has announced a 25% tariff on Indian goods, set to commence on August 27. This move is a direct response to India’s continued substantial purchases of discounted Russian crude, which now account for roughly 35% of India’s total oil imports. Such tariffs could disrupt established trade flows, potentially altering demand patterns and creating new logistical challenges in the global oil market. Investors must weigh these geopolitical pressures, which can swiftly override fundamental supply-demand balances, when assessing risk and potential returns in the energy sector.
Upcoming Events: Shaping the Near-Term Outlook
The next two weeks are packed with critical events that will undoubtedly shape the near-term trajectory of oil prices and provide answers to questions like “What are OPEC+ current production quotas?” The OPEC+ Joint Ministerial Monitoring Committee (JMMC) meeting on Saturday, April 18th, followed by the Full Ministerial meeting on Sunday, April 19th, will be closely watched. Any signals regarding production cuts, extensions of current quotas, or unexpected policy shifts could immediately impact market sentiment, particularly in light of today’s significant price declines. Following this, the market will turn its attention to the weekly inventory data, with the API Weekly Crude Inventory reports due on Tuesday, April 21st, and Tuesday, April 28th, complemented by the official EIA Weekly Petroleum Status Reports on Wednesday, April 22nd, and Wednesday, April 29th. These will offer fresh insights into U.S. demand and supply dynamics. Finally, the Baker Hughes Rig Count on Friday, April 24th, and May 1st, will provide an indication of U.S. production activity. These scheduled events serve as crucial data points for investors seeking to refine their strategies and project market movements, addressing the underlying intent behind questions about future oil prices and specific company performance like “How well do you think Repsol will end in April 2026?”


