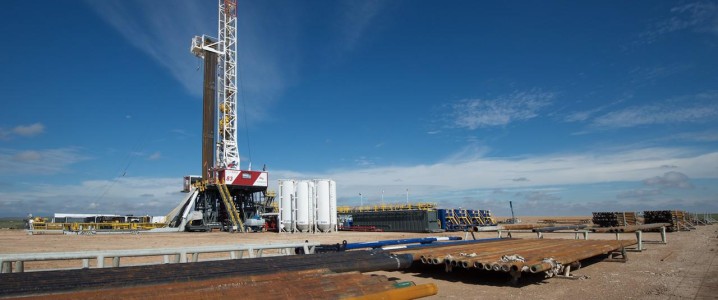
The latest Baker Hughes rig count data delivered a stark message to the oil and gas market: U.S. drilling activity is contracting significantly. This recent report, indicating a sharp decline in active rigs, particularly for oil, raises critical questions about future domestic supply at a time when global energy markets are already demonstrating pronounced volatility. For investors, understanding the implications of this slowdown, alongside prevailing market conditions and upcoming geopolitical and economic catalysts, is paramount for navigating the complex energy landscape.
The Alarming Dip in US Drilling Activity Signals Future Supply Headwinds
The U.S. total rig count experienced a notable decrease this period, falling by 10 to 544 active rigs. This represents a substantial decline of 38 rigs compared to the same time last year, underscoring a persistent downward trend in overall drilling efforts. The most impactful component of this reduction was the oil rig count, which plunged by 12 rigs to a total of 407. On a year-over-year basis, this translates to a 70-rig decline in oil-focused drilling, indicating a significant pullback in the pursuit of new crude reserves. While gas rigs saw a modest increase of 3, reaching 130 and standing 30 higher than last year, this rise is insufficient to offset the broader reduction in oil exploration and development. Key producing regions felt the pinch directly, with the Permian Basin, a cornerstone of U.S. shale production, seeing its rig count fall by 3 to 251, a considerable 52 rigs below year-ago levels. The Eagle Ford and Granite Wash basins also registered declines of 2 rigs each, further solidifying the trend of reduced upstream investment. These numbers are a clear indicator: fewer active rigs today inevitably translate to slower production growth, or even declines, in the coming months and quarters, directly impacting the trajectory of U.S. crude output.
Current Market Realities Amidst Persistent Investor Queries
Against the backdrop of a shrinking U.S. rig fleet, the current crude market tells a story of significant price appreciation and heightened volatility since these rig count figures were initially observed. As of today, Brent crude trades at $90.75 per barrel, down 8.69% within its daily range, which has swung from $86.08 to $98.97. Similarly, WTI crude stands at $83.12, reflecting an 8.83% daily decline, navigating a range between $78.97 and $90.34. This stands in stark contrast to the WTI price of $58.24 and Brent at $62.69 noted when the rig count data was initially reported, highlighting a dramatic shift in market sentiment and underlying supply-demand dynamics. The 14-day trend for Brent crude further underscores this volatility, having moved from $112.57 just a few weeks ago to $98.57, marking a $14 (12.4%) drop. Investors are keenly asking about the future, with a significant focus on questions like, “What do you predict the price of oil per barrel will be by end of 2026?” The current price environment, characterized by sharp swings and strong underlying support despite recent dips, suggests that the market is acutely sensitive to supply signals. The decline in U.S. drilling activity, therefore, adds a layer of bullish structural support that analysts and investors cannot ignore when projecting future prices, even as short-term demand concerns or geopolitical shifts introduce daily fluctuations.
The Frac Spread Paradox: Bridging Short-Term Output with Long-Term Concerns
Adding another layer of complexity to the U.S. supply outlook is the recent activity in well completions. While drilling rigs are declining, Primary Vision’s Frac Spread Count, which estimates the number of crews completing wells, actually rose for the second consecutive week. It gained 4 spreads to reach 179, although this remains below the 201 spreads active at the beginning of the year. This dynamic presents a paradox: fewer new wells are being drilled, yet existing drilled but uncompleted (DUC) wells are being brought online more rapidly. This increase in completion activity suggests that producers are prioritizing immediate production by tapping into their inventory of DUCs. This strategy can provide a temporary boost to U.S. crude oil production in the near term, as evidenced by weekly U.S. crude oil production falling only slightly for the second consecutive week to 13.814 million bpd, just 48,000 bpd under the all-time high. However, this is a finite solution. Without sustained new drilling, the inventory of DUC wells will eventually diminish, leading to a more pronounced and accelerated decline in overall output. For investors, this means differentiating between short-term production resilience driven by completions and the long-term structural supply deficit implied by dwindling drilling activity. The current strategy might alleviate immediate supply pressures but sets the stage for more significant challenges down the line.
Navigating Future Volatility: Key Events on the Horizon
The confluence of falling rig counts, volatile market prices, and strategic completion activities creates a challenging environment for investors, demanding close attention to upcoming market catalysts. A primary focus for the global energy market will be the upcoming OPEC+ meetings. The Joint Ministerial Monitoring Committee (JMMC) convenes on April 17th, followed by the Full Ministerial meeting on April 18th. These meetings are critical as investors actively seek answers to questions like, “What are OPEC+ current production quotas?” The decisions made by this influential group regarding production levels will significantly impact global supply balances and, consequently, crude oil prices. Any indication of further cuts or a commitment to maintaining current restrictions could exacerbate the supply tightness suggested by declining U.S. drilling. Domestically, the market will scrutinize the weekly API and EIA crude inventory reports on April 21st/22nd and April 28th/29th, respectively, for immediate insights into U.S. supply and demand. Furthermore, the next Baker Hughes Rig Count on April 24th and May 1st will provide crucial updates on whether the recent drilling slowdown is a temporary blip or a more entrenched trend. These events collectively will shape investor sentiment and provide much-needed clarity on the future trajectory of crude markets, influencing strategic positioning in energy equities and derivatives.