The oil and gas sector experienced a notable contraction in activity during the second quarter of 2025, a sentiment echoed by energy executives surveyed by the Dallas Federal Reserve. This period was characterized by a distinct shift towards pessimism, marked by declining production, rising uncertainty, and significant operational pressures. Our deep dive into these findings, coupled with OilMarketCap.com’s proprietary real-time market data and forward-looking event calendar, offers investors a crucial perspective on how historical sentiment can inform current strategic decisions amidst today’s volatile energy landscape. Understanding these past trends is vital for navigating the present market and anticipating future movements in oil and gas investments.
A Snapshot of Contraction and Caution in Mid-2025
The Dallas Fed Energy Survey for the second quarter of 2025 painted a clear picture of decelerating growth and increasing caution among energy firms. The broadest measure of industry health, the business activity index, plunged from a positive 3.8 in Q1 2025 to a negative 8.1 in Q2, signaling a definitive contraction. This downward shift was not isolated; the company outlook index remained pessimistic at -6.4, indicating sustained negative sentiment among executives. More critically for investors, the outlook uncertainty index climbed four points to 47.1, highlighting a significant rise in apprehension regarding future market conditions. This environment of heightened uncertainty and pessimism is precisely what can drive conservative capital allocation strategies, impacting everything from exploration budgets to M&A activity.
Production figures further underscored this downturn. Oil production saw its index fall sharply from 5.6 in the first quarter to -8.9 in the second, while natural gas production followed a similar trajectory, declining from 4.8 to -4.5. These figures suggest that exploration and production (E&P) firms were pulling back, a direct consequence of the challenging market conditions and executive sentiment. For investors, this signals a potential tightening of supply down the line, although the immediate impact would likely be felt in company revenues and profitability. The survey, conducted between June 18 and June 26, 2025, captured the sentiment of 136 energy firms, providing a robust snapshot of the industry’s mood at that time.
The Financial Squeeze: Rising Costs and Compressed Margins
Profitability and cost management were significant challenges for the energy sector in Q2 2025, particularly for oilfield services (OFS) firms. The input cost index for OFS companies rose from 30.9 to 40.0, indicating that the pace of cost increases accelerated. Simultaneously, the prices received for services index plummeted from 7.1 to a deeply negative -17.7, a clear sign that OFS firms were struggling to pass on higher costs to their clients. This double whammy resulted in a severe compression of operating margins, with the index falling from -21.5 to -33.4. For investors, these metrics reveal a tough environment for OFS providers, where declining demand and intense price competition erode earnings.
In contrast, E&P firms experienced a somewhat different cost dynamic. Their finding and development costs index decreased slightly from 17.1 to 11.4, and the lease operating expenses index also declined from 38.7 to 28.1. These figures suggest that while costs were still rising, the rate of increase had slowed compared to the prior quarter. This divergence highlights distinct pressures across the value chain, with OFS firms bearing the brunt of margin compression. The overall trend of modest deterioration for OFS, including an equipment utilization index that remained largely unchanged at -4.6, underscores the difficulty in securing new projects and maintaining healthy operational efficiency during a period of contracting activity.
Current Market Dynamics Echo Past Uncertainty: What the Data Shows Today
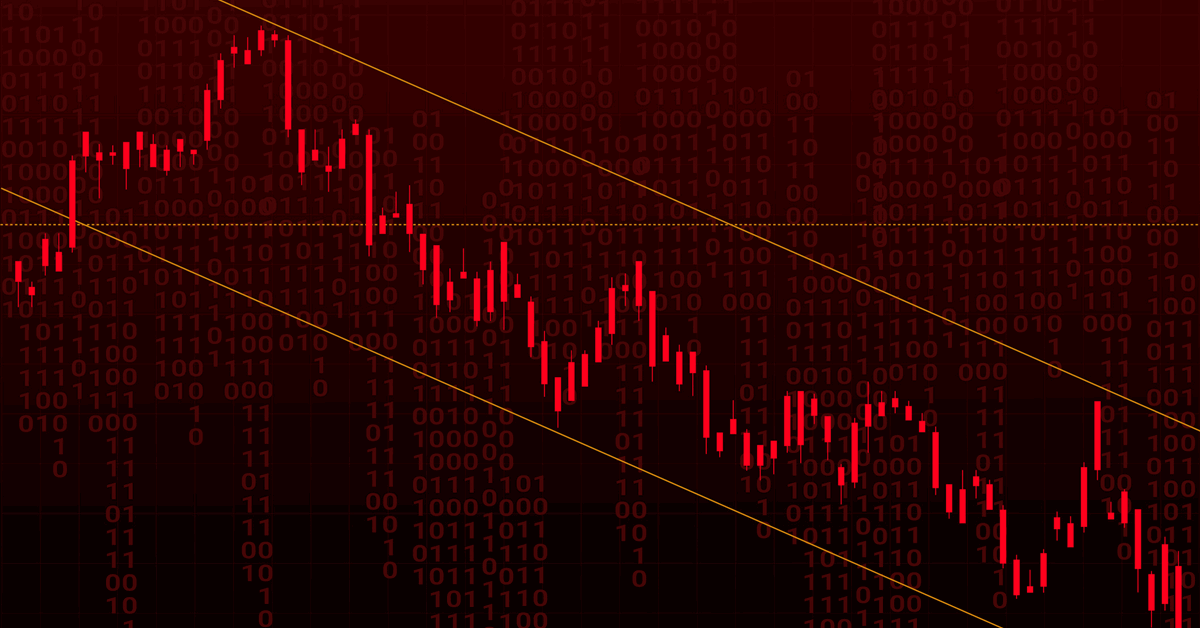
The sentiment of contraction and uncertainty observed in mid-2025 finds a stark echo in the current market conditions of early 2026. As of today, Brent crude trades at $90.38 per barrel, representing a significant 9.07% drop within the day’s trading range of $86.08 to $98.97. Similarly, WTI crude is priced at $82.59, down 9.41%, having traded between $78.97 and $90.34. This pronounced daily decline compounds a broader trend observed over the past two weeks, where Brent crude has shed 18.5% of its value, falling from $112.78 on March 30, 2026, to $91.87 on April 17, 2026. Gasoline prices have also followed suit, currently standing at $2.93, a 5.18% decrease.
This sharp market correction in 2026 intensifies the challenges outlined in the 2025 Dallas Fed survey. The previous findings of declining production intentions and compressed margins among energy executives become even more pertinent when crude prices are experiencing such significant downward pressure. Investors are acutely aware that a sustained period of lower prices will inevitably lead to further cutbacks in capital expenditure, reduce drilling activity, and exacerbate the profitability struggles for both E&P and OFS firms. The current volatility, driven by a complex interplay of macroeconomic factors and supply-demand concerns, directly feeds into the “elevated uncertainty” that executives reported, making strategic planning and investment decisions far more complex today than they were even in mid-2025.
Investor Outlook: Navigating Uncertainty with Key Upcoming Events
In this volatile environment, investors are actively seeking clarity on the future trajectory of oil prices and the factors that will shape supply. Our proprietary investor intent data reveals a strong focus on predicting where oil prices will stand by the end of 2026, alongside a keen interest in OPEC+’s current production quotas. These questions underscore the market’s anxiety and the need for actionable insights. The upcoming calendar of energy events will be critical in providing these answers and influencing market sentiment.
This weekend, April 18-19, 2026, all eyes will be on the OPEC+ Joint Ministerial Monitoring Committee (JMMC) and the full Ministerial Meeting. Any decisions regarding production levels, whether a reaffirmation of current quotas or an unexpected cut to stabilize prices, will send immediate ripples across the global oil markets. Following closely, the API Weekly Crude Inventory report on April 21 and 28, and the EIA Weekly Petroleum Status Report on April 22 and 29, will provide crucial insights into demand and domestic supply dynamics. These reports are particularly important for gauging the effectiveness of any OPEC+ actions and understanding U.S. inventory builds or draws. Furthermore, the Baker Hughes Rig Count, scheduled for April 24 and May 1, will offer a vital indicator of future drilling activity and, consequently, future production capacity in North America. For investors, monitoring these events is paramount to anticipating market shifts and making informed decisions in an energy sector still grappling with the lingering effects of past contractions and present volatility.
Human Capital and the Path Forward for Energy Investments
Beyond operational costs and market prices, the Dallas Fed survey in Q2 2025 also highlighted a concerning trend in human capital within the energy sector. The aggregate employment index declined to -6.6 from a flat zero in the prior quarter, indicating a net reduction in workforce. Complementing this, the aggregate employee hours index also turned negative, decreasing from 0.7 to -5.1, suggesting that even those who retained their jobs were working fewer hours. While the aggregate wages and benefits index remained positive, it did show a significant slowdown in growth, falling from 21.6 to 10.3. This pattern of contracting employment, reduced hours, and decelerating wage growth points to a sector under considerable strain, prioritizing cost-cutting measures over workforce expansion.
For long-term investors, these human capital trends are critical. A shrinking workforce and reduced investment in personnel can impair the industry’s ability to innovate, adapt to new technologies, and respond effectively to future demand upswings. It also signals a lack of confidence in sustained growth, reinforcing the pessimistic outlook reported by executives. The combination of declining activity, compressed margins, market volatility, and a contracting workforce presents a complex investment landscape. Success in oil and gas investing today requires not only a keen eye on real-time market data and upcoming geopolitical and economic events but also a deep understanding of the fundamental health and sentiment within the industry, as illuminated by surveys like the Dallas Fed’s report.