The global oil market has recently demonstrated its characteristic volatility, with prices reacting sharply to geopolitical developments and shifts in supply-demand fundamentals. While short-term movements often dominate headlines, seasoned investors understand the necessity of looking beyond daily fluctuations to identify structural changes. Recent analysis from commodity experts, including Standard Chartered, suggests that investors should prepare for a sustained, long-term rally in oil prices, driven by fundamental shifts in production economics that could redefine price floors for years to come. This perspective demands a closer look at both the immediate catalysts and the underlying forces shaping the future of energy investments.
Navigating Current Market Volatility Amidst Geopolitical Tensions
Recent weeks have seen significant price action, initially spurred by escalating geopolitical tensions. Reports of increased U.S. pressure on Russia, including threats of additional sanctions and tariffs unless a ceasefire with Ukraine is reached, provided an immediate bullish impulse. Similarly, a crucial trade deal between the U.S. and the European Union helped avert a broader trade war, reducing global economic uncertainty and contributing to a more positive sentiment for commodity demand. These factors, at one point, propelled crude futures to their highest levels in six weeks, with Brent for September delivery trading at $73.34 per barrel and WTI at $70.24.
However, the market’s response is rarely linear. As of today, Brent crude trades at $90.38, reflecting a significant 9.07% drop within the day, with its range spanning $86.08 to $98.97. WTI crude similarly saw a 9.41% decline to $82.59, trading between $78.97 and $90.34. This sharp daily correction follows a broader trend; Brent has shed $20.91, or 18.5%, over the past 14 days, from $112.78 on March 30th to $91.87 yesterday. This current downturn, despite the earlier geopolitical uplift, highlights the market’s sensitivity to other factors. A substantial U.S. crude inventory build, specifically an unexpected 7.7 million barrel increase in the week ending July 25th as reported by the U.S. Energy Information Administration, served as a significant counterweight, dampening the rally’s extent and contributing to the recent price softening. Total stockpiles reached 426.7 million barrels, still below the five-year seasonal average but signaling an immediate oversupply that caught many by surprise, especially given the American Petroleum Institute reported a much smaller 1.54 million barrel build a day prior.
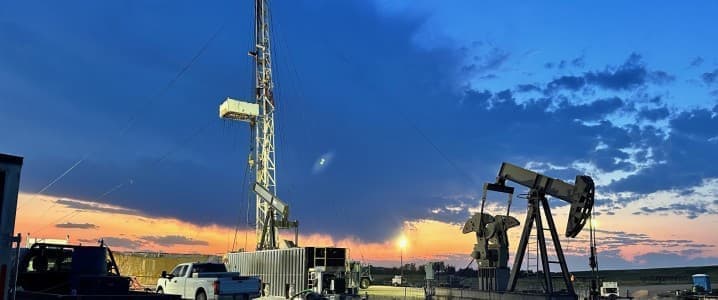
The Shifting Sands of U.S. Shale Economics
Beyond the daily headlines and inventory reports, a more profound structural shift is underway in the economics of U.S. shale production, a factor commodity analysts at Standard Chartered believe will underpin higher oil prices in the coming years. For years, the U.S. shale patch acted as a flexible supply valve, capable of ramping up production quickly and effectively capping oil prices in the $90-100/bbl range, even sending them below $60/bbl in certain periods. However, this dynamic has changed dramatically. Standard Chartered’s analysis posits that the U.S. shale industry now requires significantly higher oil prices to prevent a precipitous decline in output.
This revised breakeven point is largely attributable to surging input costs across the board. The price of steel, labor, and critical frac materials has escalated, exacerbated by factors such as President Trump’s tariffs mentioned in our previous reporting. We have noted that the average breakeven price for Permian producers, a key benchmark, is now edging back toward the mid-$60s, a notable increase from the mid-$50s just two years prior. This fundamental change means that the previous “shale put” that kept prices contained is now much higher. For investors pondering questions like “what do you predict the price of oil per barrel will be by end of 2026?”, this analysis suggests that the floor supporting prices is considerably elevated, making sustained lower prices economically unsustainable for a crucial segment of global supply.
Upcoming Events to Shape Near-Term Supply Dynamics
Looking forward, the immediate horizon is packed with critical events that will significantly influence short-term price movements and provide further clarity on supply dynamics. Investors should closely monitor the upcoming OPEC+ meetings. The Joint Ministerial Monitoring Committee (JMMC) convenes on April 18th, followed by the Full Ministerial meeting on April 19th. These meetings are pivotal, especially as many investors are keenly asking about “OPEC+ current production quotas.” The decisions made by the cartel regarding production levels will directly impact global supply and could either exacerbate or alleviate the current market volatility. Given the recent geopolitical tensions involving a major OPEC+ member, Russia, any shifts in output policy will be scrutinized for their market implications.
Beyond OPEC+, the regular cadence of inventory data will continue to offer critical insights into the immediate supply-demand balance. The API Weekly Crude Inventory reports are scheduled for April 21st and April 28th, providing an early signal, followed by the official EIA Weekly Petroleum Status Reports on April 22nd and April 29th. These reports will indicate whether the recent build observed in late July was an anomaly or the start of a trend. Furthermore, the Baker Hughes Rig Count, due on April 24th and May 1st, will offer a real-time gauge of drilling activity in the U.S., shedding light on the pace of potential future supply additions from the shale patch, which, as Standard Chartered highlights, faces new economic realities.